Skip to content
  • Categories
  • Recent
  • Tags
  • Popular
  • World
  • Users
  • Groups
Collapse
Brand Logo
UDS UDS: $2.526
24h: 0.21%
Trade UDS
Gate.io
Gate.io
UDS / USDT
MEXC
MEXC
UDS / USDT
WEEX
WEEX
UDS / USDT
COINSTORE
COINSTORE
UDS / USDT
Biconomy.com
Biconomy.com
UDS / USDT
BingX
BingX
UDS / USDT
XT.COM
XT.COM
UDS / USDT
Uniswap v3
Uniswap v3
UDS / USDT
PancakeSwap v3
PancakeSwap v3
UDS / USDT

Earn up to 50 UDS per post

Post in Forum to earn rewards!

Learn more
UDS Right

Spin your Wheel of Fortune!

Earn or purchase spins to test your luck. Spin the Wheel of Fortune and win amazing prizes!

Spin now
Wheel of Fortune
selector
wheel
Spin

Paired Staking

Stake $UDS
APR icon Earn up to 50% APR
NFT icon Boost earnings with NFTs
Earn icon Play, HODL & earn more
Stake $UDS
Stake $UDS
UDS Left

Buy UDS!

Buy UDS with popular exchanges! Make purchases and claim rewards!

Buy UDS
UDS Right

Post in Forum to earn rewards!

UDS Rewards
m_c_jacobM

m_c_jacob

@m_c_jacob
About
Posts
136
Topics
91
Shares
0
Groups
0
Followers
0
Following
0

Posts

Recent Best Controversial

  • 🥈 Silver dropped like a rock — but bounced like a spring.
    m_c_jacobM m_c_jacob

    XAGUSD_2025-10-30_11-10-51.png

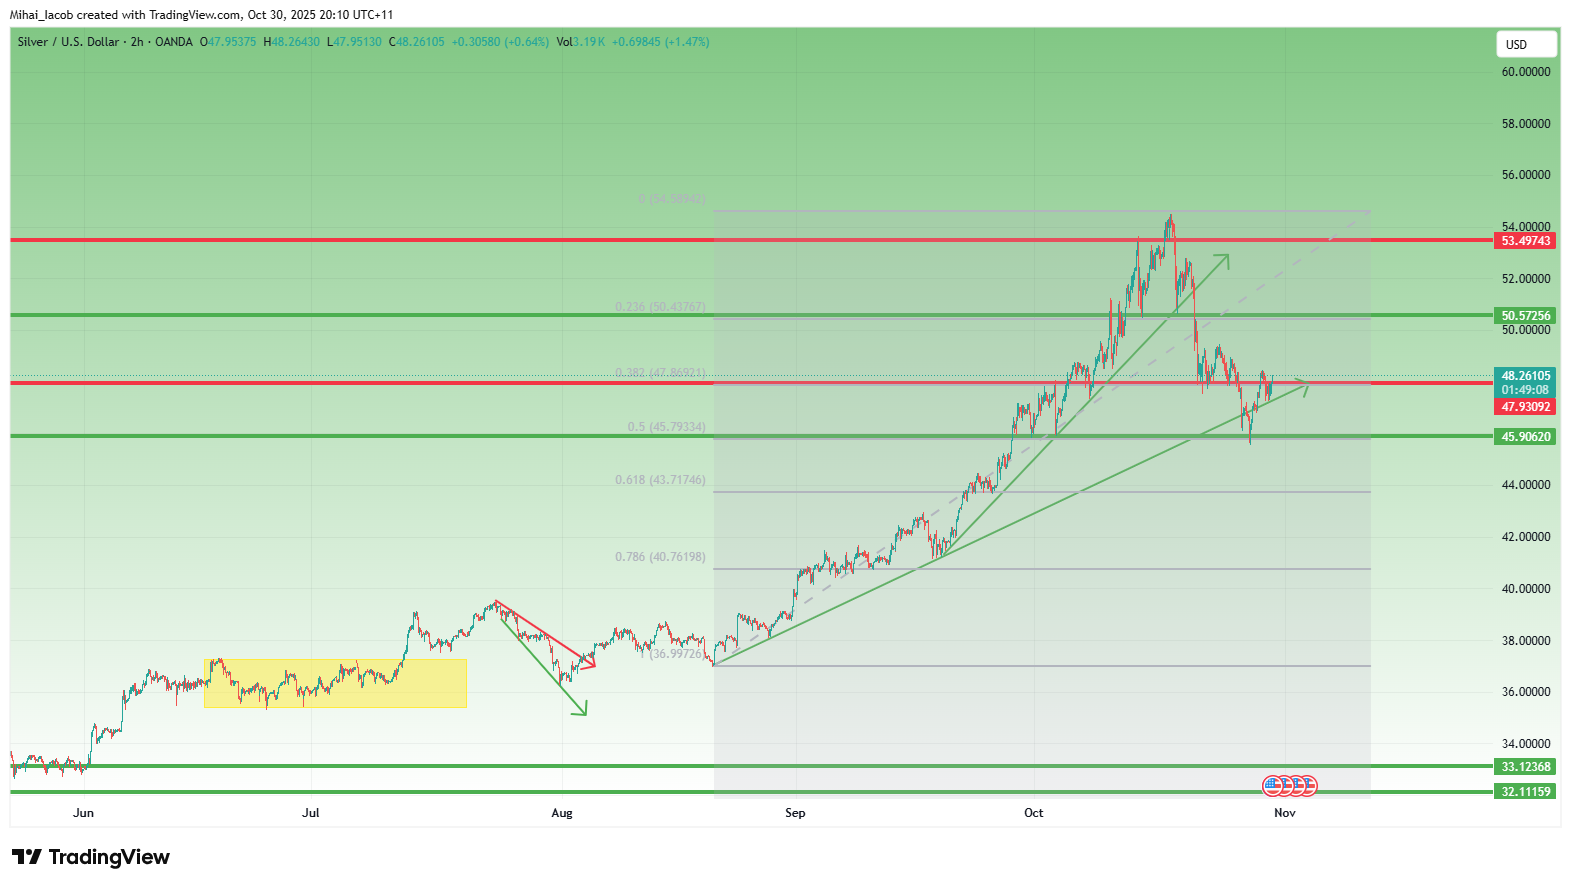
    While Gold has been volatile, Silver’s drop has been even more spectacular — a breathtaking 9,000-pip decline in just 10 days, from the all-time high near 54.50 down to 45.50, a correction of roughly 20%.
    But let’s not forget — the prior rally was just as extreme: from 37 to almost 55, a 50% surge.
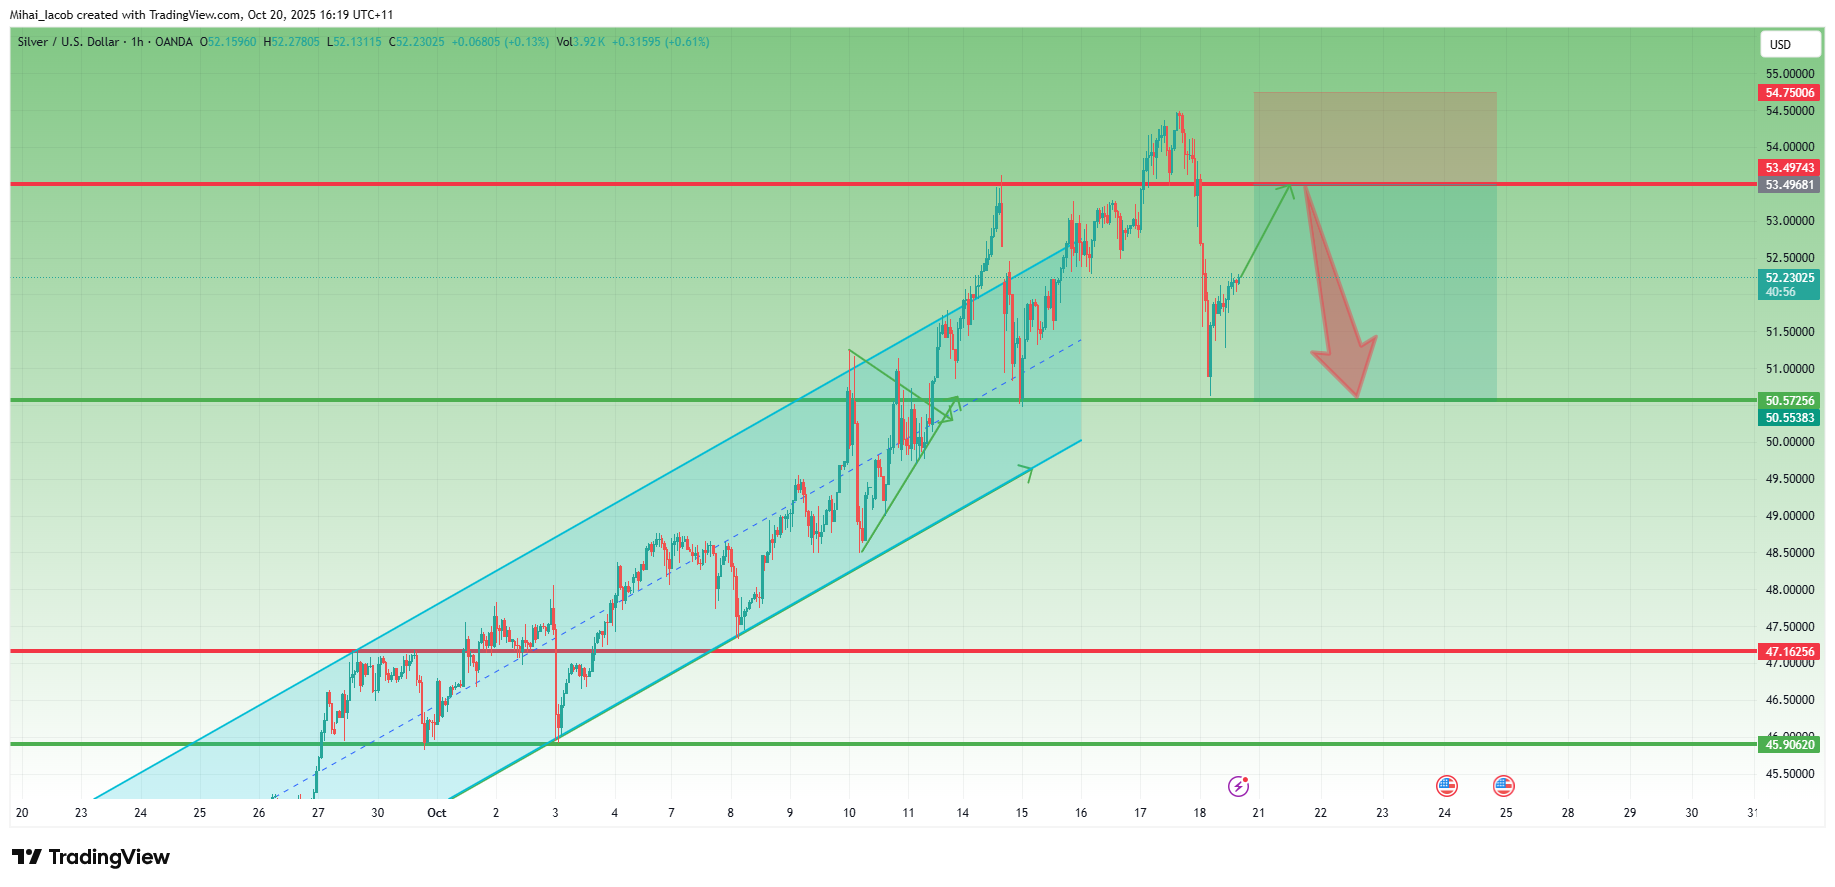
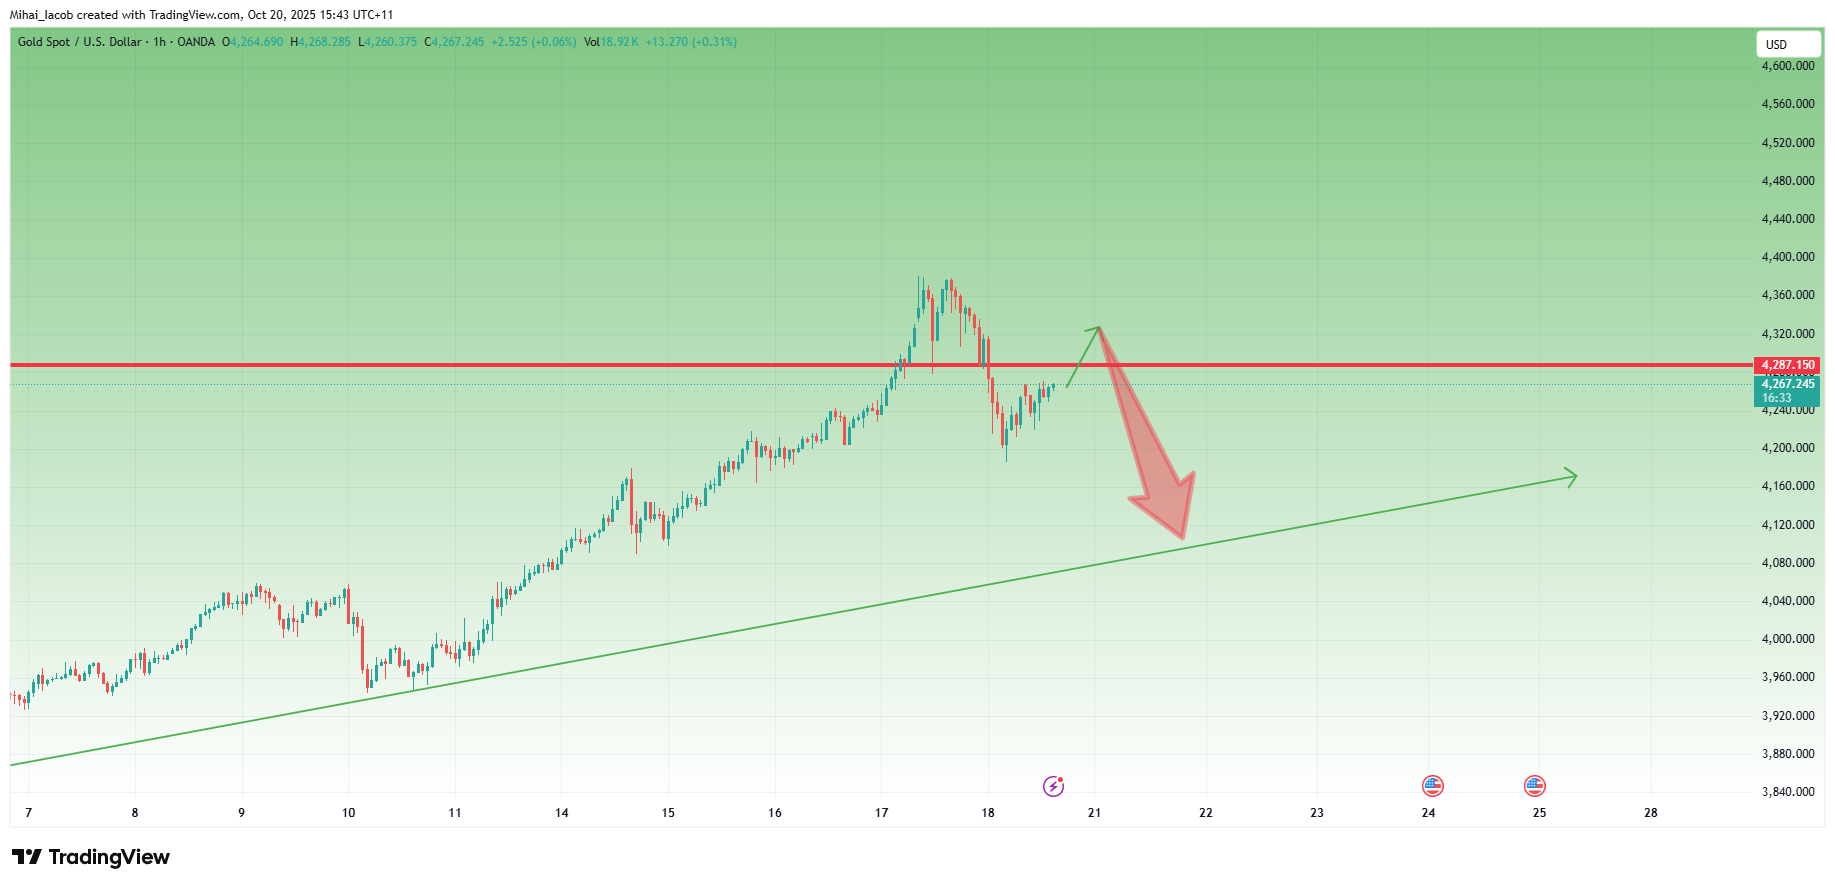
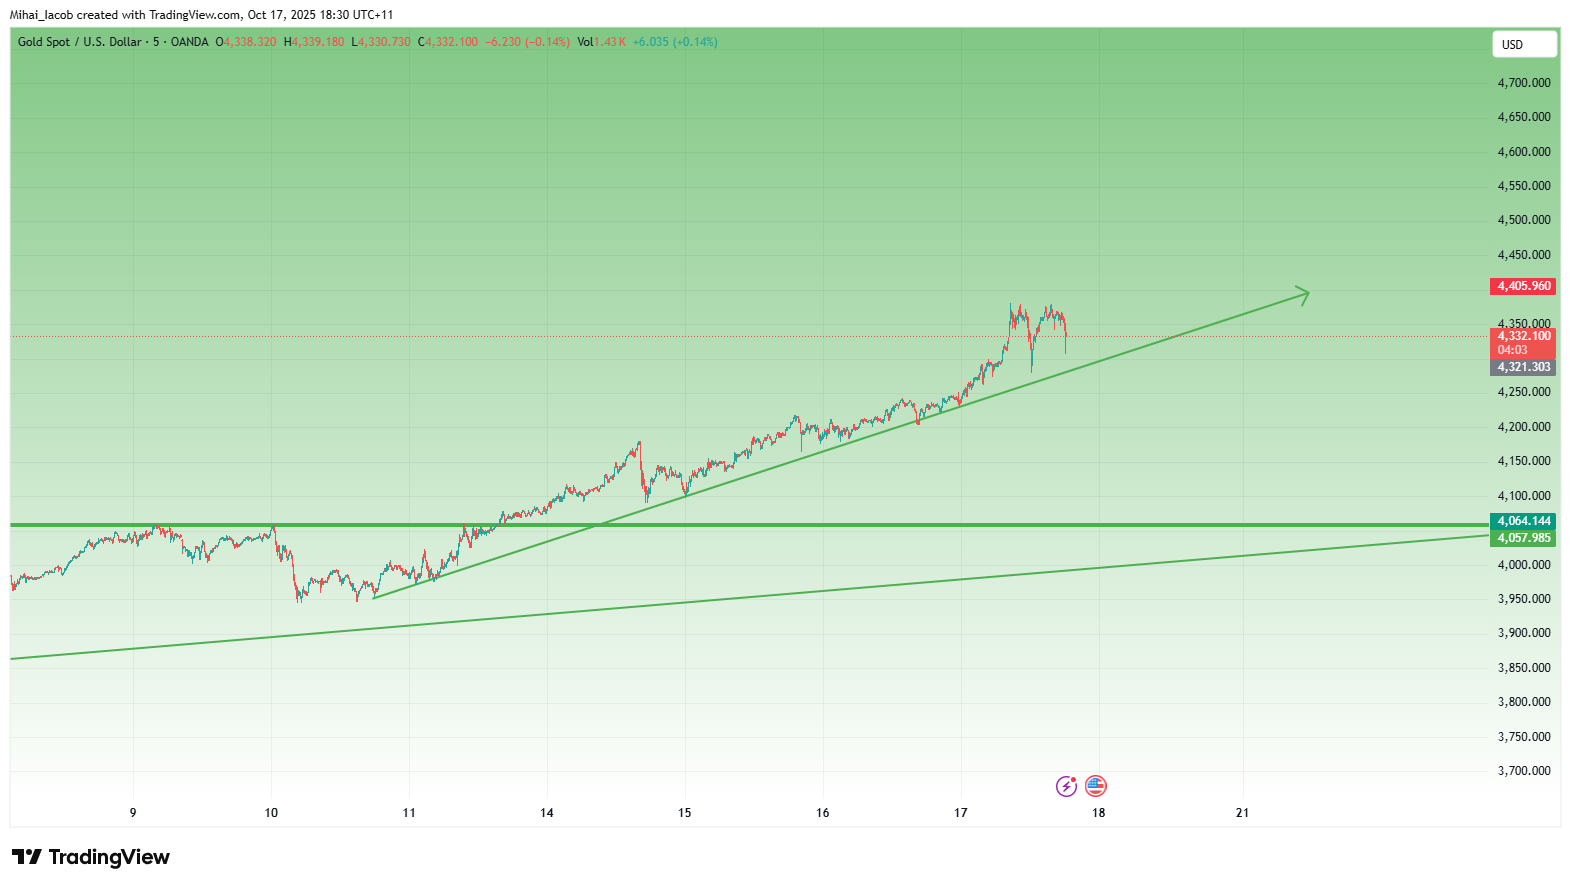
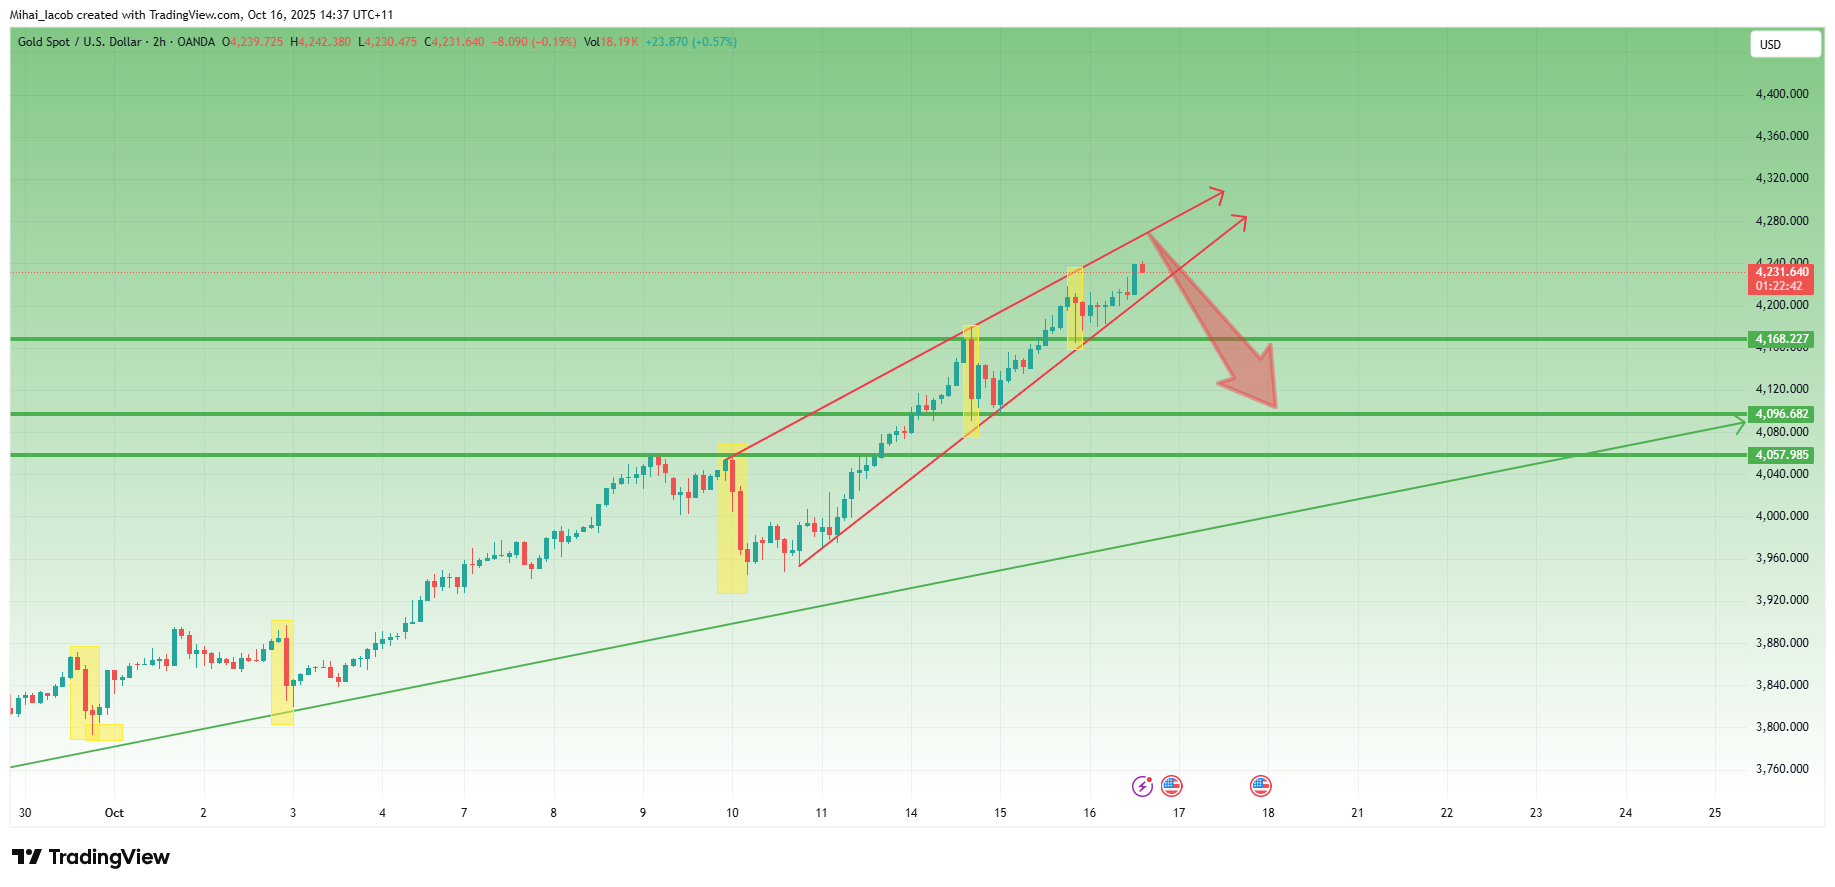
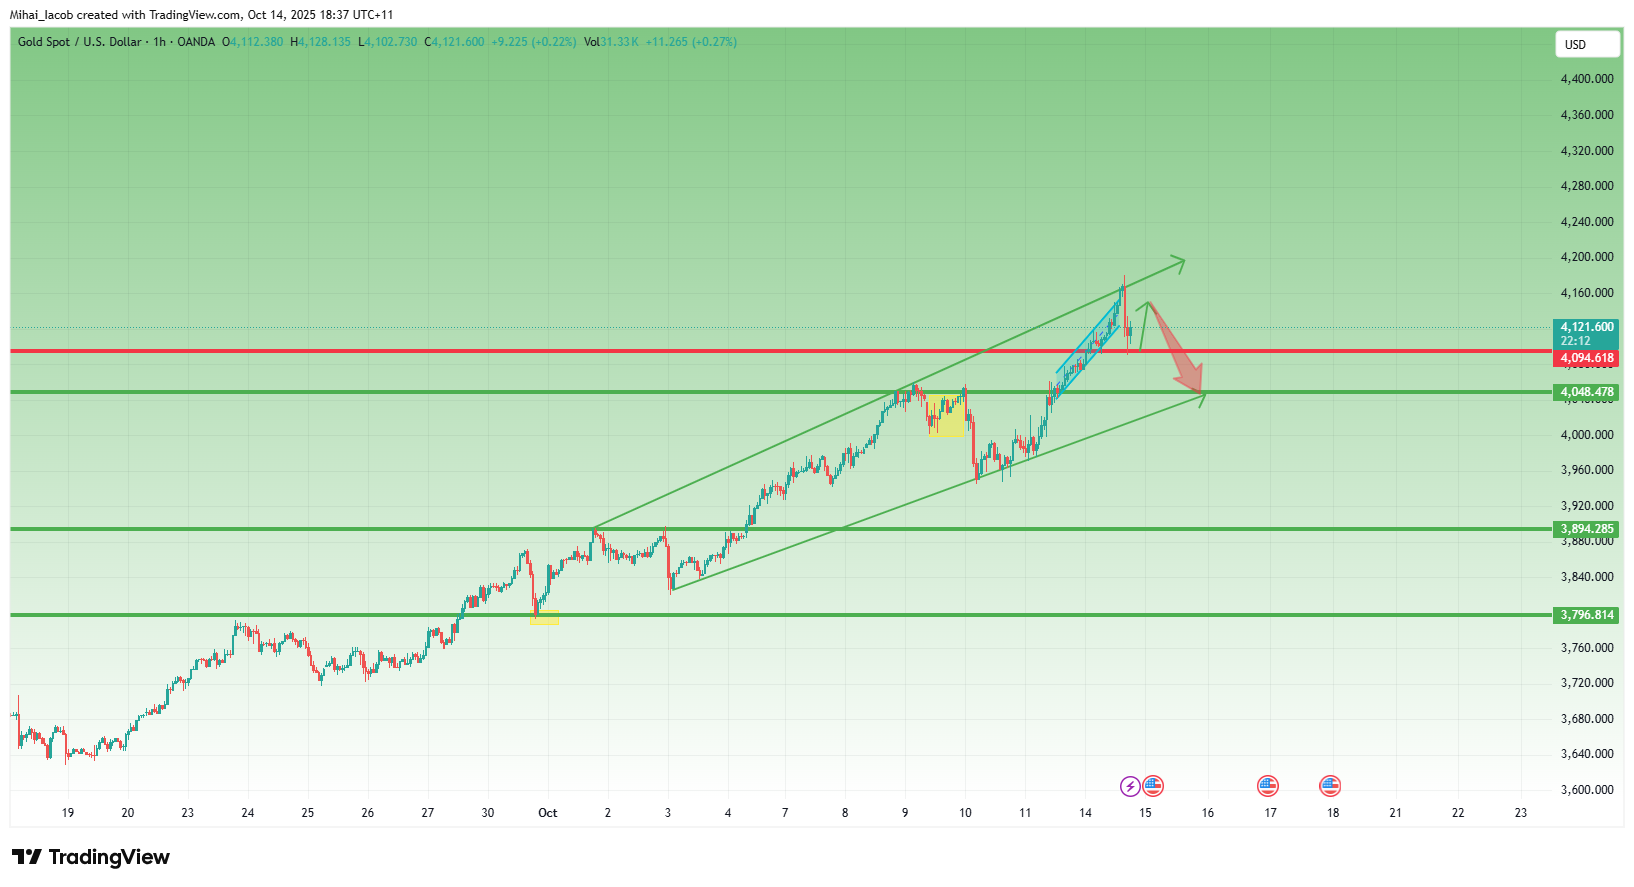
    This kind of price behavior is typical for Silver — sharp on both sides. Yet, compared to Gold, the recent structure shows a few key differences worth noting:


    🔍 Key Observations

    1. Back Above the Ascending Trendline
      After the recent low two days ago, Silver managed to climb back above the ascending trendline that started in late August — a strong early sign of stabilization.
    2. Perfect 50% Retracement Support
      The correction stopped exactly at the 50% Fibonacci retracement, perfectly aligned with a major horizontal support zone — a classic technical confluence.
    3. Higher Low Confirmed
      Unlike Gold, Silver printed a clear higher low last night, strengthening the case for a bullish recovery setup.

    🎯 Outlook
    Putting it all together, Silver appears to have completed its correction and looks technically stronger than Gold at this stage.
    If the current momentum continues, a new test above 50 seems increasingly likely in the coming sessions.
    🚀

    Trading

  • Silver: After New All-Time Highs, a Sharp Correction
    m_c_jacobM m_c_jacob

    XAGUSD_2025-10-20_08-19-04.png

    Last week, Silver reached a new all-time high, almost touching my $55 target.
    However, on Friday, the market delivered a powerful sell-off, with the price dropping by around 4,000 pips — from the $54.50 ATH down to the $50.50 support zone.

    At this stage, I expect the price to stabilize and form a temporary base of consolidation.
    My focus now shifts to the $53.50 resistance zone, which could act as a short-term decision point.

    If I observe signs of weakness or rejection in that area, I’ll consider short positions, targeting a potential retest of the $50 support zone.

    Trading

  • 4,000 Pips Up, 2,000 Down – Gold’s Wild Ride Continues!
    m_c_jacobM m_c_jacob

    XAUUSD_2025-10-20_07-43-27.png

    Last week has been a wild ride for Gold traders, with the price rallying aprox 4,000 pips (around 10%), only to sell off 2,000 pips on Friday in what many expected to be a well-deserved correction.

    The big question now is: was that correction enough, or is Gold preparing for another leg down before continuing higher?

    In my view, this was just the first leg of the correction, and I expect another wave of selling to come this week.

    Currently, Gold is recovering from Friday’s sharp drop, and this rebound could potentially push prices back above 4,300.
    If that happens, I’ll be watching closely for signs of weakness to position myself short.

    Overall, I believe a new test of the 4,200 area is likely before any sustainable recovery can take place.

    Trading

  • Gold- For now stay out of the yo-yo
    m_c_jacobM m_c_jacob

    XAUUSD_2025-10-17_10-30-56.png

    Gold rose this week — so far (and I really want to stress so far) — by around 10%. That’s massive by any standard.

    On Monday, I tried to catch a dip and missed it. Since Tuesday, I’ve been on the sell side — completely wrong on direction, yet somehow still managed to finish positive overall.

    Yesterday my stop got hit, but after what happened overnight, it turned out to be just a scratch. With this kind of volatility, a recovery of 250pips can happen in ten minutes.

    Looking at the chart — it’s bullish, no question. Should it be bought? Hmmmm...
    Looking at the volatility… for me, it’s become untradeable.

    Can it keep going higher? Of course.
    How high? Nobody knows.
    At this point, any prediction is just throwing numbers in the air.

    Trading corrections, as I’ve tried to do, is a guessing game. I’ve had some luck so far, but after yesterday's stop loss, I’m stepping aside.

    My take: stay out. Let others make money if they can.
    A 1,000-pip rise and an equal reversal — all while I was asleep (and trust me, I sleep very little) — is too crazy. Stops can be wiped for bulls just as easily as for bears.

    At some point, it will settle down and define its levels.
    Until then — it’s not for me anymore.

    Trading

  • Doge- Support turned resistance
    m_c_jacobM m_c_jacob

    DOGEUSDT_2025-10-16_18-52-25.png

    Friday’s crash took DOGE below two key support zones —
    first, the ascending trendline around 0.23,
    and then the horizontal support near 0.21.

    After the drop, DOGE attempted a recovery that only brought it back to retest the broken 0.21 level, which has now turned into resistance. The price has since started to roll back down.

    At this stage, if the negative sentiment across the crypto market continues, the probability of a deeper correction remains high — with the next significant target around 0.15.

    Only a sustained move above 0.21 would neutralize this bearish scenario and open the path for a potential rebound.

    Trading

  • 🚀 Bitcoin Holding Strong Above $110K – Breakout Loading?
    m_c_jacobM m_c_jacob

    110k is too obvious, but I hope it will hold

    Trading

  • Bitcoin Under Pressure: 108-110k Zone Support Now Critical
    m_c_jacobM m_c_jacob

    Exactly, we need to stay above, it is imperative

    Trading

  • Bitcoin Under Pressure: 108-110k Zone Support Now Critical
    m_c_jacobM m_c_jacob

    BTCUSD_2025-10-16_12-19-33.png

    I’m struggling to maintain my bullishness lately — not because of Friday’s crash, but because, regardless of what timeframe I analyze, I just can’t find a convincing bullish bias anymore.

    On the weekly chart, the structure looks increasingly fragile. After breaking above the 108k zone in mid-summer, Bitcoin pushed to a new ATH around 125k, then pulled back to retest the broken resistance. That was fine — a normal retest within a healthy uptrend. But what followed wasn’t.

    The price made a new, but very anemic all-time high, showing a clear lack of momentum, and then dropped again to the same support area. Even if this drop was provoked, the fact that BTC returned so quickly to that zone makes me question the strength of any potential reversal.

    From a technical standpoint, if we ignore the reasons and look only at the chart, the last 3.5 months resemble more of a distribution phase rather than a solid consolidation before another leg up.

    If Bitcoin breaks below the 108k support, the next logical target sits around 100k. But considering the long-term structure I’ve shown on the weekly chart, I wouldn’t be surprised to see a deeper correction toward 90k.

    The bulls are still in the game, but they’re losing ground — and unless BTC shows strength soon, the market might be preparing for another leg down before any sustainable recovery

    Trading

  • Why I Didn’t Buy Gold in the Last Few Weeks
    m_c_jacobM m_c_jacob

    XAUUSD_2025-10-16_06-37-18.png

    I’ve been bullish on gold since the beginning of the year — expecting it to reach $3000, and in a very optimistic scenario, maybe even $3500. My previous posts are proof of that.
    But I definitely wasn’t expecting $4000, and certainly not $4200, for one simple reason:
    Some time ago, my crystal ball broke, and since then I’ve been trying to base my trades on technical analysis and what I’ve actually seen happen in the past — not on wishful thinking.


    When Price Doesn’t Correct, But You Still Profit Selling
    Ever since gold hit the $3700–$3800 zone, I’ve been expecting a correction.
    It never came.
    Even so, I still made money selling against the trend — something I usually avoid and definitely don’t recommend anyone to do.
    But this post isn’t about my trades. It’s about why I didn’t buy gold in the last two or three weeks.
    And the answer is right there — on the chart.


    The Chart Tells the Truth
    If you look closely, you’ll see yellow rectangles highlighting the sharp drops that happened during this period.
    It’s easy to look at the chart after the fact and say:
    “I should’ve bought there.”
    But imagine you don’t see the right side of the chart.
    You’re sitting in front of your screen, looking at the current price, trying to decide what to do.
    And then — within minutes — gold drops 700-800 pips out of nowhere.
    No signal. No alert on WhatsApp. No warning.
    Where do you put your stop?
    Do you trade without one?
    Just because you know it will bounce?
    And what if it doesn’t?
    What if it drops another 1000 pips — the same way it just did — without even breathing?
    That’s not trading. That’s hope disguised as confidence.


    This Is an Exercise in Honesty
    This is an exercise in honesty with yourself — not after you’ve seen the chart.
    How many of you would’ve stayed in a position that’s -500 pips, just because you “know” it will turn around?
    Even now, right after I finished recording the video, it dropped another 500+ pips like it was nothing.
    I’ve explained this a thousand times:

    1. If a trade is not there, it’s not there. Period.
      I don’t force it. I don’t FOMO.
    2. A trade must have a clear entry, stop, target — and most importantly, a reason.
      “Gold is rising, can’t you see?” is not a reason. It’s FOMO.

    If You Want to Be a Real Trader, Remember This

    1. The market has two directions, even when it looks like it only has one.
    2. In aggressive trends, even my cat becomes a great trader.
    3. Every trade must have a clear reason. If it doesn’t, and you enter just because “it’s going up”, that’s FOMO — and we all saw what happened to crypto in 2021. People are still waiting for the mythical altcoin season, while some are still 70- 90% down on the bag
    4. We’re all geniuses after seeing the chart: “should’ve bought there, closed there…”
    5. The only real truth is in your equity — and mine is higher, even though I’ve been selling.
    6. I can guarantee there are gold bulls reading this right now who lost money on long positions over the past month.
    7. In the end, it all comes down to money management and timing.

    Conclusion:
    Trading isn’t about being bullish or bearish.
    It’s about being disciplined, timing and money management; the rest is can-can, and "I told you so"

    P.S. Once again, I’m looking to sell — and if it works out like my last five trades, that’s perfectly fine with me.
    At the club, they don’t ask whether I paid for my champagne with profits from buying or selling gold.
    🍾

    General Discussion

  • Gold- Everyone is buying, I'm watching for a top
    m_c_jacobM m_c_jacob

    XAUUSD_2025-10-16_06-37-18.png

    As we’ve grown used to by now, Gold sets a new ATH almost every day — and by the time we, in Europe, wake up, it’s already 300–400 pips higher.
    Yet despite the strong bullish momentum, speculative trading remains extremely difficult. Sudden drops of hundreds of pips can easily hit your stop loss if your entry timing isn’t perfect.

    From my perspective — even though I don’t have an open position — the idea remains the same: a correction is inevitable.
    Since Friday’s low, the price has rallied around 3,000 pips — a fabulous move, but like any late-stage rally, it’s becoming excessive and irrational (even more than it already was).
    Of course, it can always go higher, but the more it exaggerates, the faster it tends to normalize.

    As I mentioned before, my approach remains focused on identifying potential tops — and while that’s the riskiest thing a trader can do, it has worked quite well during the sharp downward spikes of the last two weeks.

    Technically, the move from Friday’s low is forming a rising wedge, with resistance around 4270, which is where I’ll be looking to sell.
    The target zone is roughly 1,000 pips lower.

    One encouraging factor — even more so than before — is the noticeable narrowing of the spread between futures and spot, now at just 0.2–0.25%, compared to the usual ~1% (and sometimes higher) during strong bullish phases.

    Trading

  • Powell Just Lit the Fuse — Markets Are Heating Up!
    m_c_jacobM m_c_jacob

    The problem is that technically is not confirmed, more, is hinting down

    Trading

  • Crypto Calls in Short Format with Mihai Iacob
    m_c_jacobM m_c_jacob

    ETH: Looking strong

    Despite the crypto crash, ETH has moved very technically.
    The break below $4,300 sent it down to $3,500, but a rebound above $3,850 pushed the price back to the $4,300 resistance.

    After another pullback, ETH found support again at $3,850 and quickly bounced to $4,100.
    The chart now shows an ascending triangle with resistance at $4,300 — a breakout could send ETH toward $4,900–$5,000.

    I’m looking to buy dips below $4,000, with a 1:3–1:4 risk-reward setup. 🚀

    ETHUSD_2025-10-15_10-07-47.png

    General Discussion

  • ETH to 5k next? Confirmation needed though
    m_c_jacobM m_c_jacob

    ETHUSD_2025-10-15_10-07-47.png

    In spite of the crypto market crash, Ethereum actually moved very technically.

    The break below the $4,300 support led to a drop toward the important $3,500 zone.
    Although the price also broke below $3,850, a quick reversal followed — the rebound brought the price back above the $3,850 support and up to the $4,300 resistance.

    A new wave of selling came next, but this time, the price stopped around the $3,850 support zone, confirming it as an important level.
    A quick rebound followed, and now ETH is back above $4,000, trading around $4,100.

    Also very important — the price of ETH is forming an ascending triangle, with resistance at $4,300.
    A break above $4,300 will most likely accelerate gains toward the $4,900–$5,000 area, which is both a technical resistance and the target of the triangle.

    I’m looking to buy on dips, preferably below $4,000, and considering the mentioned target, such a setup offers around a 1:3 or even 1:4 risk-reward ratio.

    Trading

  • ALGO – Reversal from the Final Support Zone
    m_c_jacobM m_c_jacob

    ALGOUSD_2025-10-15_06-33-01.png

    Like most altcoins, Algorand also ended Friday’s crash by touching its final support zone, then strongly reversed.
    After dropping to 0.10, the coin rebounded sharply and reclaimed the next key level at 0.15.

    Currently trading around 0.20, ALGO is showing early signs of stabilization. If the overall crypto recovery continues, this setup could develop into a solid bullish signal.

    The confirmation comes with a break above 0.2250, which would mark the end of the correction that started in December last year — opening the way toward the 0.40 zone.

    Let’s see if the market confirms it. 🚀

    Trading

  • Crypto Calls in Short Format with Mihai Iacob
    m_c_jacobM m_c_jacob

    LINK – Back in the Game 🚀

    Chainlink briefly lost the 18.50 support and dropped below $10, but quickly recovered, reclaiming that key zone and re-entering the bullish flag from late August.
    No clear buy signal yet — but a break above 21.50 could confirm a new leg toward $30.
    Let the market confirm it. 🚀

    LINKUSDT_2025-10-15_05-37-14.png

    General Discussion

  • LINK – Back Inside the Bullish Flag 🚀
    m_c_jacobM m_c_jacob

    LINKUSDT_2025-10-15_05-37-14.png

    On Friday night, Chainlink lost its confluence support from the 18.50 zone and dropped sharply to just under $10.
    However, looking at the chart, we can clearly see the importance of this area, marked by both the 2022–2023 accumulation resistance and the 2024 lows.

    From there, the coin rebounded fast, managing to reclaim the 18.50 support and re-enter the bullish flag that started forming at the end of August.
    This recovery shows strong buying interest — but no clear buy signal has yet appeared.

    For now, LINK remains a coin to watch closely.
    A confirmed breakout above 21.50 would open the door for a new bullish leg, with 30 USD as the next technical target.

    Trading

  • Why This BTC Price Action Doesn’t Inspire Confidence (yet)
    m_c_jacobM m_c_jacob

    BTCUSD_2025-10-14_17-55-26.png

    In my yesterday’s analysis, I raised a rhetorical question: Is Bitcoin in a corrective rebound, or are we witnessing a genuine upside reversal?

    Even in my Sunday educational post, I mentioned that the whole “great reset, now we go up” narrative doesn’t resonate with how I view trading.

    At the time of writing, BTC is down again around 112K, after touching once more the 110K support zone — almost like a second chance for those who missed the first dip.
    However, this kind of price action is far from encouraging in my opinion.


    Technical Picture
    • The price reversed before the 118K resistance, forming what can now be viewed as a lower high.
    • If the 110K level breaks, the next obvious target remains 100K, both from a psychological and technical perspective.


    Trading Plan
    My plan is to sell preferably around the recent high, aiming to position with the broader structure rather than chase short-term fluctuations.
    BTC still needs to prove it can sustain an uptrend — until then, rallies look like selling opportunities rather than the start of a new bull leg.

    Trading

  • Gold- Final of the insane rally?
    m_c_jacobM m_c_jacob

    Thanks for the nice words, guys:)

    Trading

  • Gold- Final of the insane rally?
    m_c_jacobM m_c_jacob

    XAUUSD_2025-10-14_10-37-48.png

    In my Sunday video, I argued that after Friday’s close it seemed likely that 4100 could be next for Gold — and indeed, Gold didn’t just stop there, it printed a new all-time high at 4180.
    Yesterday, as usual, when I woke up Asia had already done its job — we’re used to that by now — and I found the price 400 pips higher. So, I simply watched.

    However, last night, considering that after a 1500+ pip rally at least a correction could follow, I decided to take a short position — a very risky one, to be fair.

    Luck (and timing) were on my side, and by the time of writing this post, the price already dipped under 4100, and my trade was closed with a +600 pip take profit.


    The Big Question:
    Is Gold done with this insane rise?
    In my opinion — yes, at least temporarily.
    There’s no secret that the price is overstretched, and if we look carefully at the chart, the recent 4,000-pip rise is contained within an expanding triangle.
    We saw a short-lived spike above the resistance of that triangle — and also above the ascending channel — followed by a strong 1,000-pip reversal in just two hours, clearly signaling heavy profit-taking.
    At this moment, the price has stopped its descent around the horizontal level below 4100, and we’re seeing a technical rebound.
    I plan to use this rebound as a new selling opportunity.
    While my first short targeted the 4100 area, my second trade will aim for the 4050 zone, which coincides with last week’s all-time high and now acts as a key confluence support.


    Final Thoughts
    Markets often humble us — and they do it with irony.
    Although I'm very bullish on Gold overall, my last five trades have all been shorts.
    And the irony? The results are more than satisfying:
    ✅ +550 pips
    ❌ -200 pips
    ➖ Break-even
    ✅ +350 pips
    ✅ +600 pips
    That’s +1,300 pips profit from trading drops in a bullish market.
    The market truly has a sense of humor. 😄

    Trading

  • Crypto Calls in Short Format with Mihai Iacob
    m_c_jacobM m_c_jacob

    CAKE — Bulls Still in the Game 🍰

    In my previous analysis, I mentioned that CAKE could rise to 5 USD after breaking above a 1.5-year accumulation range.
    The coin reached 4.5 USD, then dropped sharply during Friday’s liquidation — but unlike many others, it quickly recovered above support, showing strong bulls.

    As long as 3 USD holds, the outlook remains bullish, with 5 USD still the medium-term target.
    Plan: Buy dips near 3 USD. 🚀

    CAKEUSDT_2025-10-14_06-11-50.png

    General Discussion

  • Login or register to search.
Powered by NodeBB Contributors
  • First post
    Last post
0
  • Categories
  • Recent
  • Tags
  • Popular
  • World
  • Users
  • Groups