Skip to content
  • Categories
  • Recent
  • Tags
  • Popular
  • World
  • Users
  • Groups
Collapse
Brand Logo
UDS UDS: $2.5271
24h: 1.30%
Trade UDS
Gate.io
Gate.io
UDS / USDT
MEXC
MEXC
UDS / USDT
WEEX
WEEX
UDS / USDT
COINSTORE
COINSTORE
UDS / USDT
Biconomy.com
Biconomy.com
UDS / USDT
BingX
BingX
UDS / USDT
XT.COM
XT.COM
UDS / USDT
Uniswap v3
Uniswap v3
UDS / USDT
PancakeSwap v3
PancakeSwap v3
UDS / USDT

Earn up to 50 UDS per post

Post in Forum to earn rewards!

Learn more
UDS Right

Spin your Wheel of Fortune!

Earn or purchase spins to test your luck. Spin the Wheel of Fortune and win amazing prizes!

Spin now
Wheel of Fortune
selector
wheel
Spin

Paired Staking

Stake $UDS
APR icon Earn up to 50% APR
NFT icon Boost earnings with NFTs
Earn icon Play, HODL & earn more
Stake $UDS
Stake $UDS
UDS Left

Buy UDS!

Buy UDS with popular exchanges! Make purchases and claim rewards!

Buy UDS
UDS Right

Post in Forum to earn rewards!

UDS Rewards
m_c_jacobM

m_c_jacob

@m_c_jacob
About
Posts
136
Topics
91
Shares
0
Groups
0
Followers
0
Following
0

Posts

Recent Best Controversial

  • Silver, telling a different story than Gold
    m_c_jacobM m_c_jacob

    XAGUSD_2025-10-10_11-34-51.png

    Yesterday:
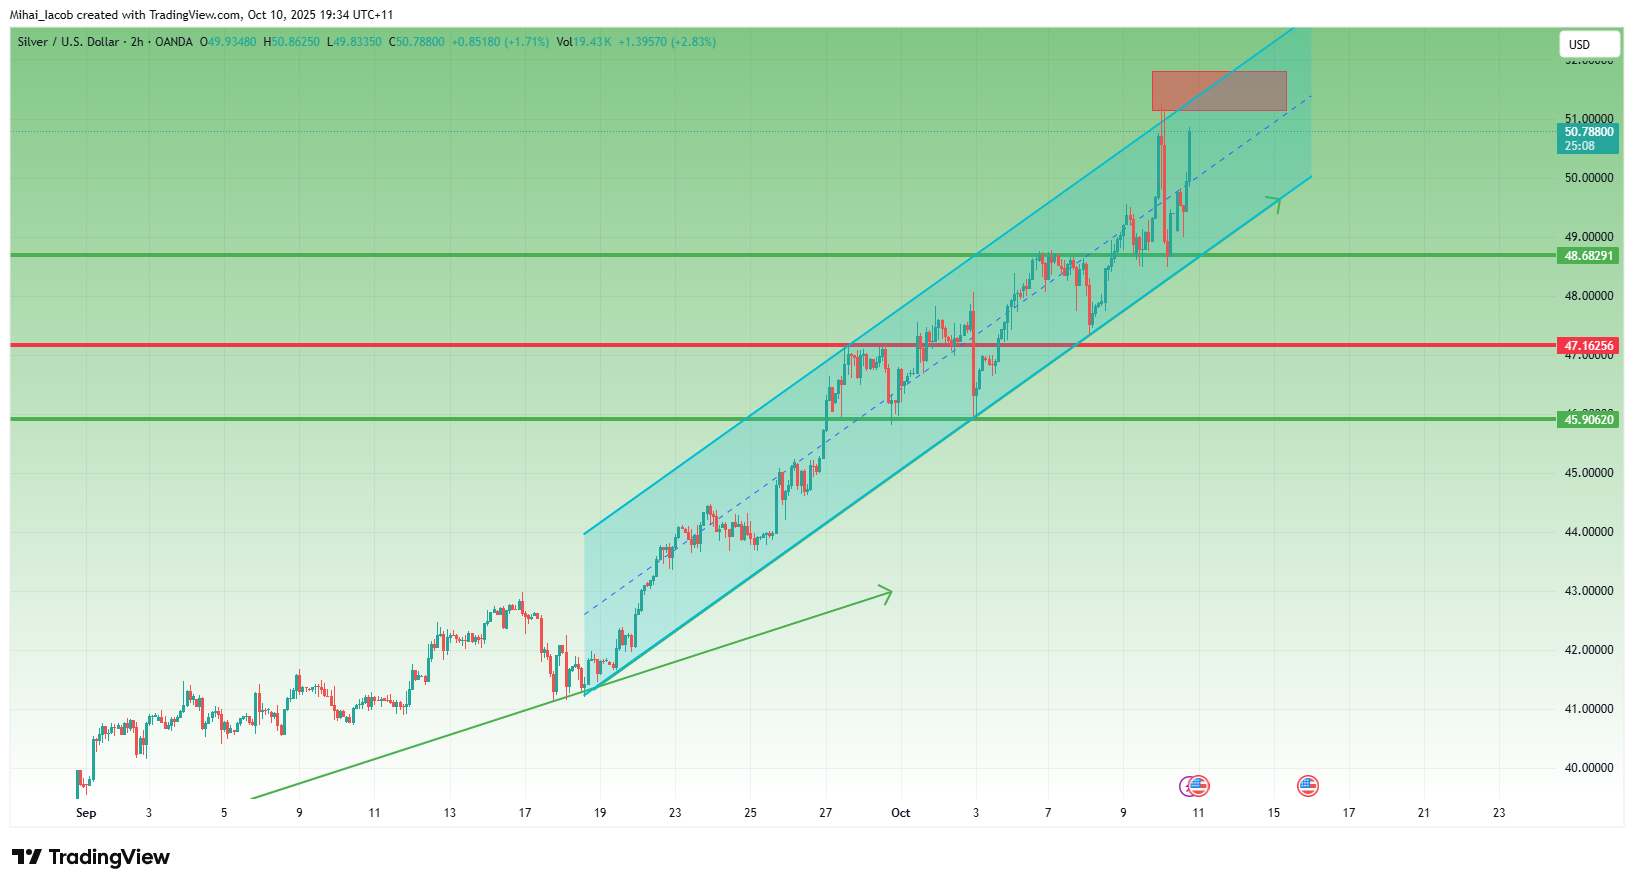
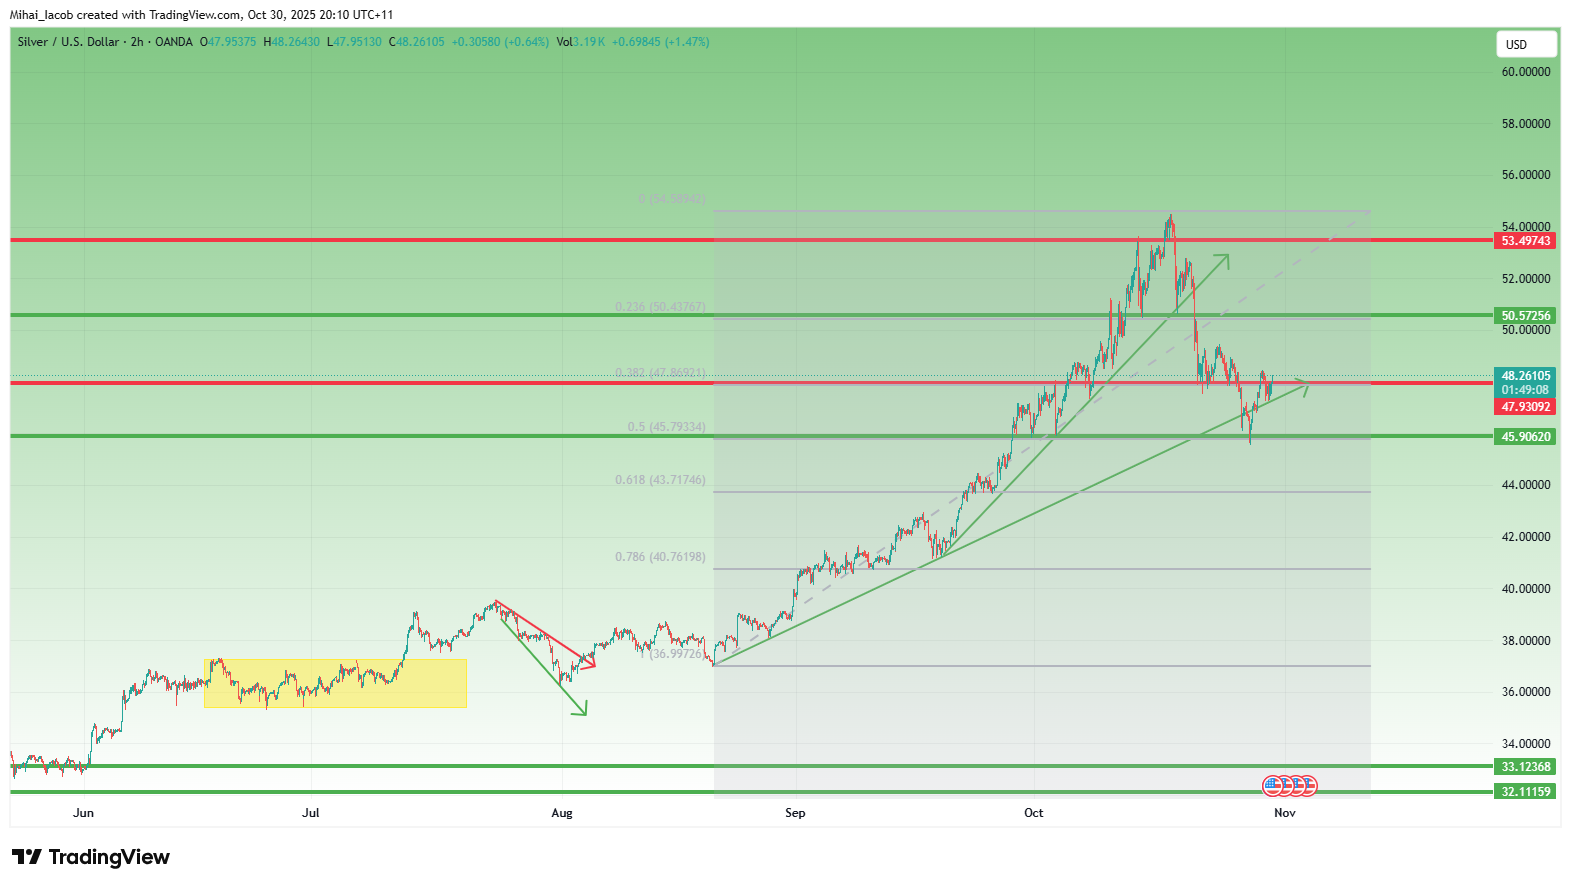
    Silver finally made a new All-Time High, a moment that many precious metal traders have been waiting for.
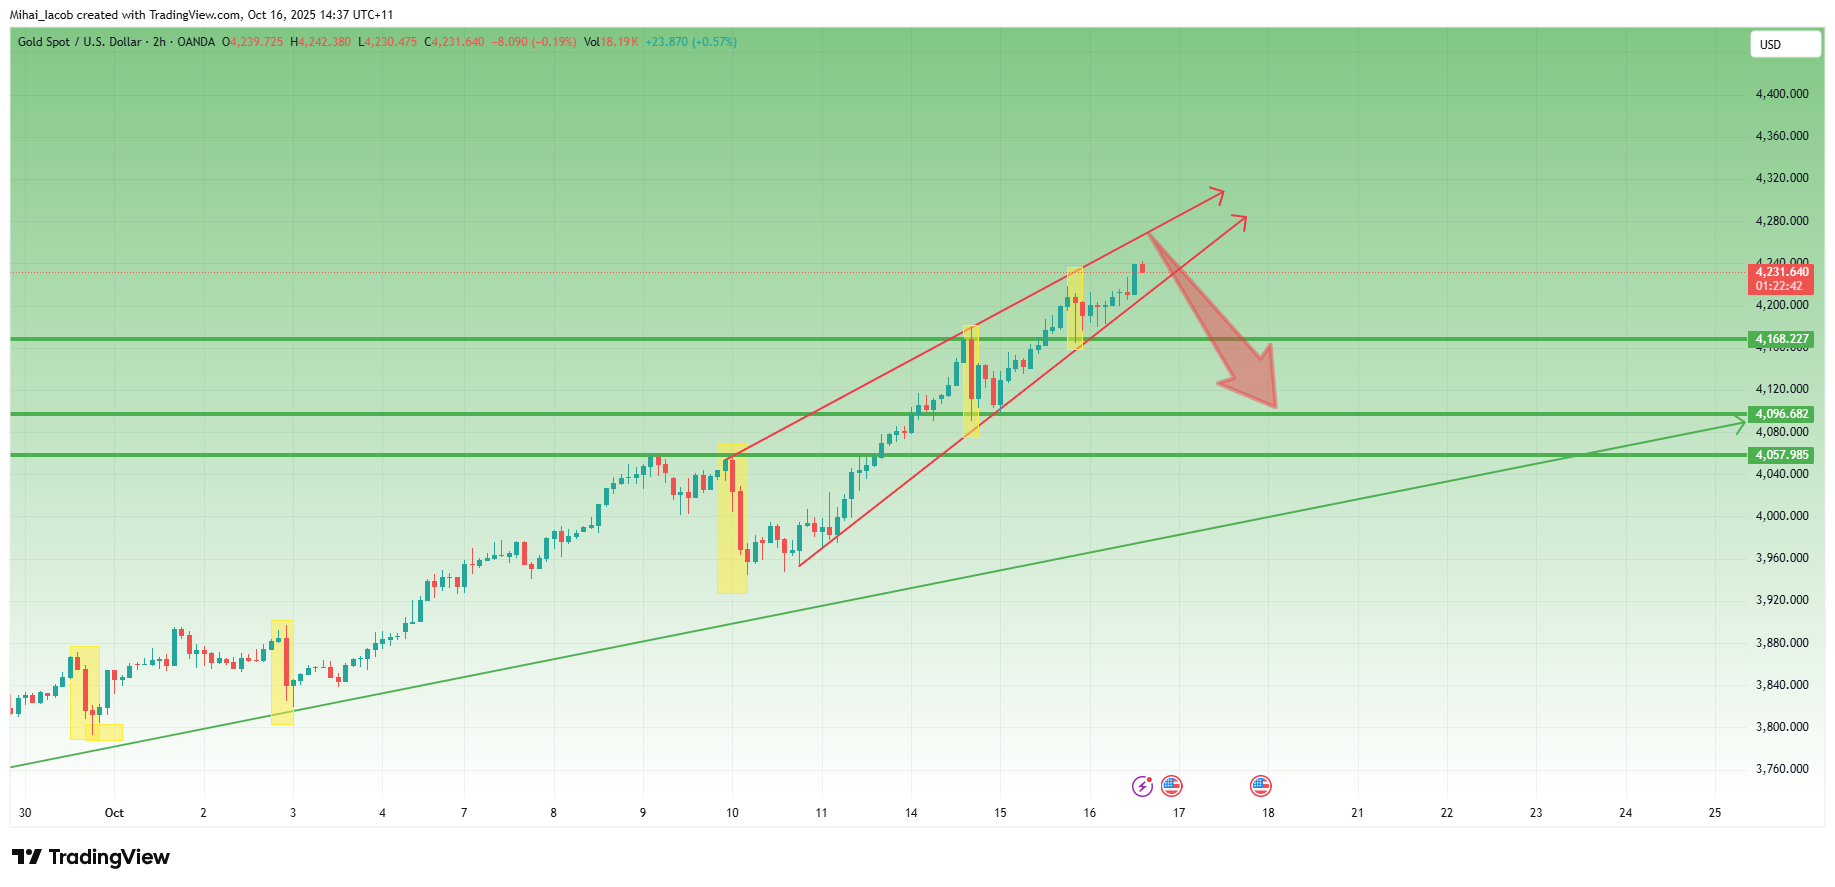
    After touching the 51.20 zone, price also experienced a sharp drop, similar to what we saw in Gold.
    However — the situation here is notably different.


    Key Technical Observations
    1. Support Retest, Not Overlap:
    The recent drop found support on a horizontal level that acted as strong resistance earlier this week.
    Unlike Gold, the structure didn’t overlap — a clear technical advantage.
    2. Bullish Structure Intact:
    The correction remained above the ascending channel’s support line, meaning Silver never exited its bullish formation — another plus point.
    3. Strong Rebound:
    At the time of writing, Silver is showing a solid recovery, reclaiming both the 50.00 level and the median line of the channel — a third technical confirmation of strength.


    Trading Bias
    Unlike Gold, my bias on Silver is bullish in the short term now.
    If Gold manages to rebound above 4,000, as I expect in the short term, there’s a high probability that Silver will print a new ATH.


    Key Level to Watch
    I’ll be watching closely the upper boundary of the channel and yesterday’s high.
    Since I’m currently out of the market and late to join the bullish leg, I’ll wait for price action to show its hand.
    If signs of weakness appear in that zone, I’ll consider short opportunities, targeting yesterday’s low.
    Until then — it’s a wait-and-see approach.

    Trading

  • 🥈 Silver dropped like a rock — but bounced like a spring.
    m_c_jacobM m_c_jacob

    XAGUSD_2025-10-30_11-10-51.png

    While Gold has been volatile, Silver’s drop has been even more spectacular — a breathtaking 9,000-pip decline in just 10 days, from the all-time high near 54.50 down to 45.50, a correction of roughly 20%.
    But let’s not forget — the prior rally was just as extreme: from 37 to almost 55, a 50% surge.
    This kind of price behavior is typical for Silver — sharp on both sides. Yet, compared to Gold, the recent structure shows a few key differences worth noting:


    🔍 Key Observations

    1. Back Above the Ascending Trendline
      After the recent low two days ago, Silver managed to climb back above the ascending trendline that started in late August — a strong early sign of stabilization.
    2. Perfect 50% Retracement Support
      The correction stopped exactly at the 50% Fibonacci retracement, perfectly aligned with a major horizontal support zone — a classic technical confluence.
    3. Higher Low Confirmed
      Unlike Gold, Silver printed a clear higher low last night, strengthening the case for a bullish recovery setup.

    🎯 Outlook
    Putting it all together, Silver appears to have completed its correction and looks technically stronger than Gold at this stage.
    If the current momentum continues, a new test above 50 seems increasingly likely in the coming sessions.
    🚀

    Trading

  • ADAUSD – Symmetrical Triangle Points to Upside Breakout
    m_c_jacobM m_c_jacob

    alt text

    As highlighted in my previous ADA analysis, I’ve maintained a bullish bias, recommending buys below 0.80 USD. Since then, price has indeed revisited the 0.80 support zone and rebounded strongly.

    More importantly, since mid-August, ADA has been consolidating within a symmetrical triangle. Technically, this is a continuation pattern, and given that the broader trend from 0.50 (mid-June) has been constructive to the upside, probabilities favor an eventual bullish breakout.

    Key Levels & Plan:

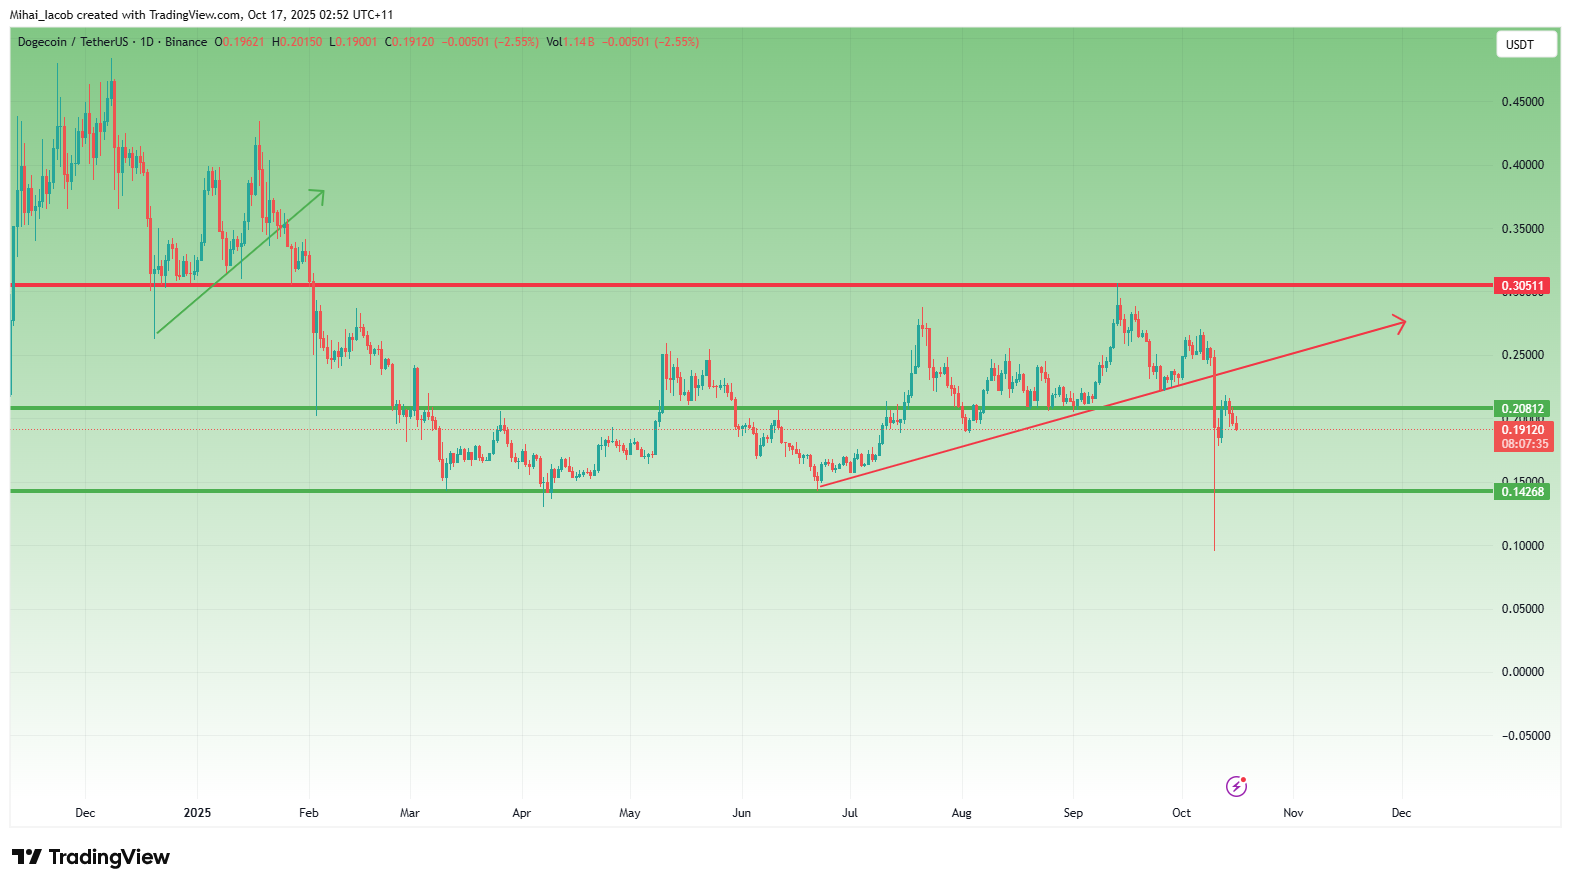
    ✅ Bullish bias remains intact above 0.80 USD

    ⚡ Breakout confirmation above 0.95 USD (recent resistance)

    🎯 Upside target: 1.30 USD – a reasonable and achievable objective if momentum extends

    Conclusion: Until proven otherwise, ADA’s structure suggests an upside continuation once resistance gives way. A breakout above 0.95 would serve as the clear green light for further gains. 🚀

    Trading

  • ICPUSD – Trading the Range with Precision
    m_c_jacobM m_c_jacob

    alt text

    Since December last year, ICP has been in a persistent downtrend, sliding from 15 USD to below 5 USD. Sellers have clearly dominated the longer-term picture.

    However, after establishing April’s low, the market transitioned into a well-defined sideways range between 4.5 and 6.2 USD. This type of consolidation after a heavy decline often signals a pause – and can present trading opportunities within the boundaries.

    Right now, ICPUSD is once again testing the bottom of this range near 4.5. From a tactical perspective, this creates a favorable setup: by entering long positions at the range low, we can aim for the upper boundary with a 1:3.5 risk-to-reward ratio.

    Trading Plan:

    ✅ Favor long positions near 4.5 USD

    🛑 Place a tight stop-loss just below range support

    🎯 First target: 6.0 – 6.2 USD, the upper range resistance

    Conclusion: Until ICPUSD breaks decisively below support, the range remains intact. I favor buying dips with disciplined risk management, targeting the 6 USD area for a clean swing trade setup. 🚀

    Trading

  • $LTC Update – Testing Resistance, Bulls in Control!
    m_c_jacobM m_c_jacob

    Hihi, exactly the coin I was looking at:)
    On long term however...

    Trading

  • Stop Blaming Market Manipulation: It’s Just Your Wrong Interpretation
    m_c_jacobM m_c_jacob

    The Excuse Factory

    Recently, Bitcoin dropped from 118k to 108k.
    Suddenly, TikTokers, YouTubers, and X posters spiraled into paranoia, copy-pasting the same narrative: the “big masterminds,” reptilians, or aliens manipulated the market to liquidate 1.7 billion in buy orders.

    Let’s pause for a second. A 10% pullback in Bitcoin is now considered “market crash”? If we look deeper, Ethereum fell about 20% from its top — but this same ETH had already grown 300% since April.
    Was that also “manipulation”? Or does manipulation only happen when you lose money?

    How do you think markets work in general? Do they move only upward, just to make you richer?

    The truth is simpler: there is no manipulation conspiracy here. There are no “false signals.” What exists are wrong interpretations.

    The Market Is Neutral

    The market doesn’t care about your position. It doesn’t send “false” signals; it simply moves.
    Price action reflects the sum of supply and demand in each moment. When traders label a signal as “false,” what they really mean is:

    • They misread the context.

    • They didn’t account for a higher timeframe.

    Their stop placement wasn’t aligned with market structure or too close.

    The market doesn’t lie. It only reveals how much or how little you understand it.

    Examples of Misinterpretation

    1. The “false breakout” myth – What you see as a false breakout on the 1H chart may be a perfect retest on the daily timeframe. The market wasn’t wrong—you were looking at it from the wrong lens.

    2. Stop hunting paranoia – Many traders cry “manipulation” when price takes out a cluster of stops. But think: stops are liquidity, and liquidity is where big players need to fill orders. That’s not manipulation—it’s how markets function.

    3. News volatility – Many traders call sudden spikes around economic releases “market tricks.” In reality, it’s about liquidity gaps. There aren’t buy and sell orders evenly distributed at every price level. When major news hits, price “rearranges” itself to include the new information and moves sharply until it finds liquidity — usually around strong support or resistance zones.

    The Psychology Behind Blame

    Blaming manipulation is easier than admitting error. It protects the ego. If the loss was due to some shadowy force, you don’t have to change. But this mindset locks traders into a cycle of frustration. Progress begins when you stop blaming the market and start analyzing your own decision-making.

    Case Study: Ethereum’s Current Setup

    ETHUSD_2025-09-28_12-08-46.png

    As the saying goes, a picture says more than a thousand words.
    Since April, Ethereum has rallied over 300% in just six months. On this path upward, the chart shows two apparent “false breaks” of support.

    The question now is: will the current move be the third “false break,” or the first real break? As I wrote in yesterday’s analysis, confirmation is key.

    But even if ETH drops further, say to 3600, nothing truly changes in the broader picture. Such a move would only be a healthy correction of the trend that started in April — perfectly aligning the price with the 38% Fibonacci retracement and the rising trendline support.

    Conclusion: The Trader’s Responsibility

    There are no false signals. There is no hidden enemy in the market. There is only your interpretation.

    The moment you accept this, your growth accelerates. Losses turn from “proof of manipulation” into valuable feedback. And instead of fighting an imaginary villain, you start refining your edge.

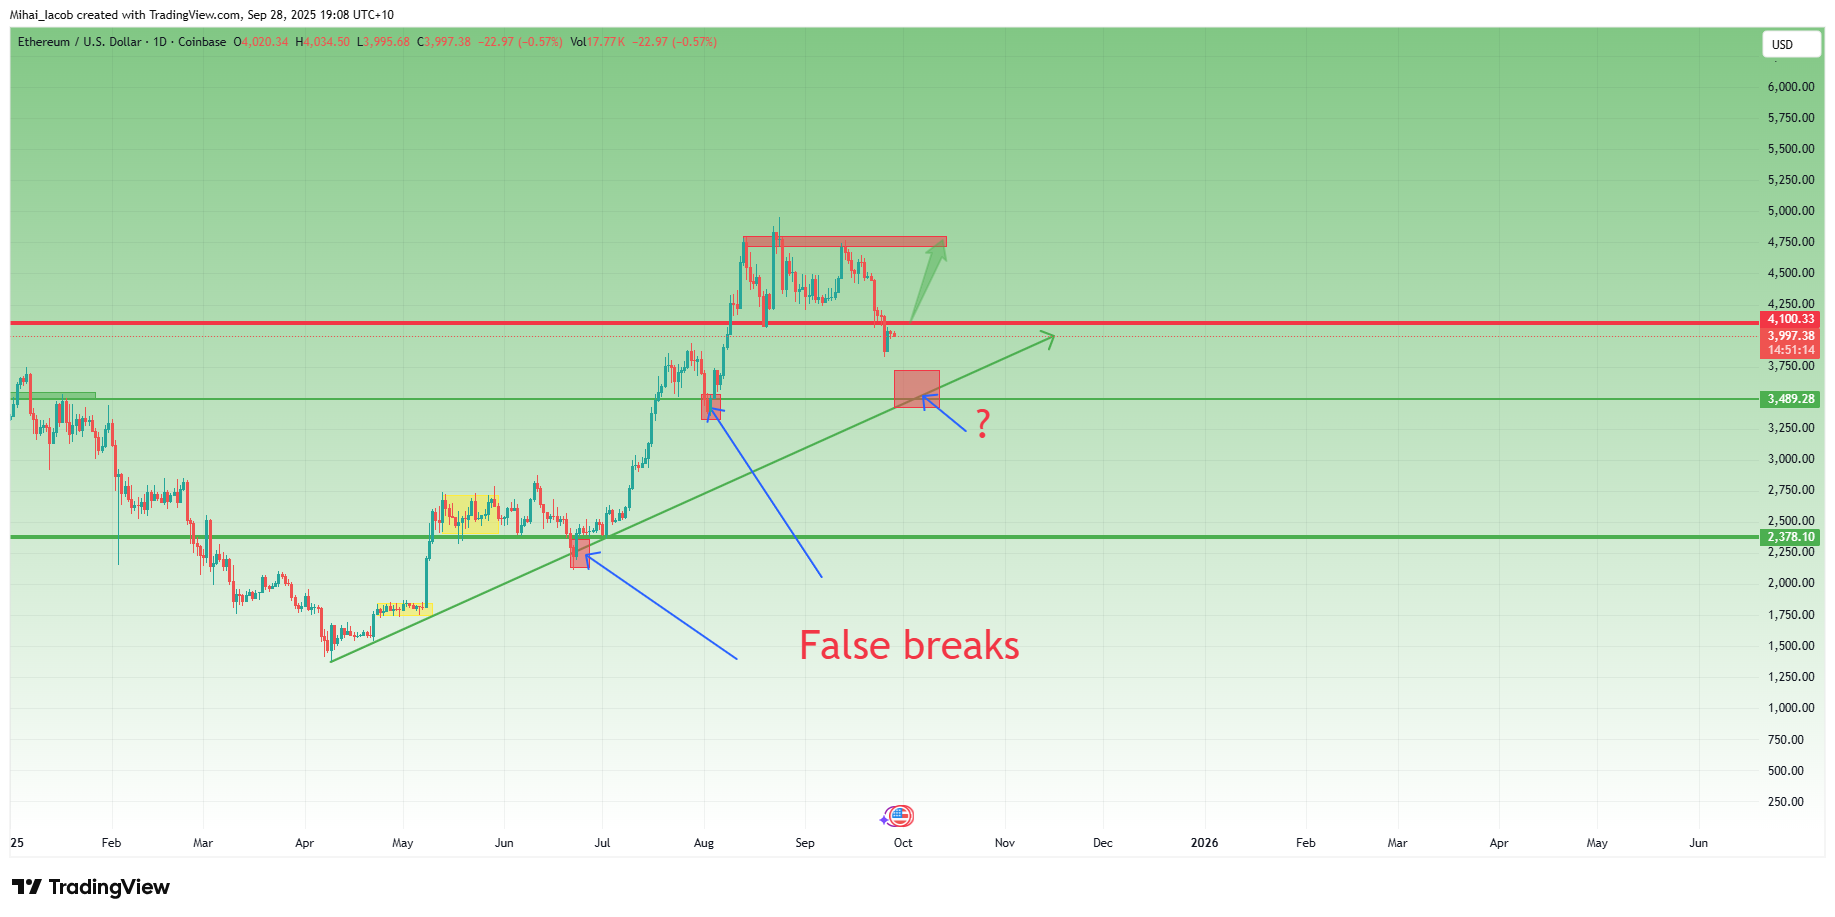
    👉 The market doesn’t fool you. It teaches you. If you listen carefully, you’ll realize it’s never been against you—it’s only been holding up a mirror. 🚀

    Hero Portfolio

  • Powell Just Lit the Fuse — Markets Are Heating Up!
    m_c_jacobM m_c_jacob

    The problem is that technically is not confirmed, more, is hinting down

    Trading

  • Doge- Support turned resistance
    m_c_jacobM m_c_jacob

    DOGEUSDT_2025-10-16_18-52-25.png

    Friday’s crash took DOGE below two key support zones —
    first, the ascending trendline around 0.23,
    and then the horizontal support near 0.21.

    After the drop, DOGE attempted a recovery that only brought it back to retest the broken 0.21 level, which has now turned into resistance. The price has since started to roll back down.

    At this stage, if the negative sentiment across the crypto market continues, the probability of a deeper correction remains high — with the next significant target around 0.15.

    Only a sustained move above 0.21 would neutralize this bearish scenario and open the path for a potential rebound.

    Trading

  • EGLD – Third Touch at $12 Support Could Ignite a Major Reversal
    m_c_jacobM m_c_jacob

    EGLDUSDT_2025-10-06_17-45-30.png

    EGLD has been on my radar for quite some time...
    After forming a major low in April and rallying back toward the $22 zone, the coin pulled back again — effectively confirming that level as strong support.
    By the end of September, price revisited the $12 area for the third time, and once again buyers stepped in decisively, triggering a solid rebound. Now, EGLD trades around $14, sitting just below a falling trendline that has capped upside momentum for months.


    Technical Outlook
    • Support: $12 (triple-tested, major demand zone)
    • Resistance: Falling trendline around $14–15
    • Soft target: $22 (key resistance and prior reversal area)


    My Trading View
    Given the strength of this repeated support and the contracting structure, I believe this trendline resistance is likely to break soon. If momentum follows through, EGLD could accelerate sharply to the upside, mirroring past explosive moves.
    The setup remains constructive — buying dips above $12 could offer a strong risk–reward opportunity heading into the next leg higher.

    Trading

  • Why I Didn’t Buy Gold in the Last Few Weeks
    m_c_jacobM m_c_jacob

    XAUUSD_2025-10-16_06-37-18.png

    I’ve been bullish on gold since the beginning of the year — expecting it to reach $3000, and in a very optimistic scenario, maybe even $3500. My previous posts are proof of that.
    But I definitely wasn’t expecting $4000, and certainly not $4200, for one simple reason:
    Some time ago, my crystal ball broke, and since then I’ve been trying to base my trades on technical analysis and what I’ve actually seen happen in the past — not on wishful thinking.


    When Price Doesn’t Correct, But You Still Profit Selling
    Ever since gold hit the $3700–$3800 zone, I’ve been expecting a correction.
    It never came.
    Even so, I still made money selling against the trend — something I usually avoid and definitely don’t recommend anyone to do.
    But this post isn’t about my trades. It’s about why I didn’t buy gold in the last two or three weeks.
    And the answer is right there — on the chart.


    The Chart Tells the Truth
    If you look closely, you’ll see yellow rectangles highlighting the sharp drops that happened during this period.
    It’s easy to look at the chart after the fact and say:
    “I should’ve bought there.”
    But imagine you don’t see the right side of the chart.
    You’re sitting in front of your screen, looking at the current price, trying to decide what to do.
    And then — within minutes — gold drops 700-800 pips out of nowhere.
    No signal. No alert on WhatsApp. No warning.
    Where do you put your stop?
    Do you trade without one?
    Just because you know it will bounce?
    And what if it doesn’t?
    What if it drops another 1000 pips — the same way it just did — without even breathing?
    That’s not trading. That’s hope disguised as confidence.


    This Is an Exercise in Honesty
    This is an exercise in honesty with yourself — not after you’ve seen the chart.
    How many of you would’ve stayed in a position that’s -500 pips, just because you “know” it will turn around?
    Even now, right after I finished recording the video, it dropped another 500+ pips like it was nothing.
    I’ve explained this a thousand times:

    1. If a trade is not there, it’s not there. Period.
      I don’t force it. I don’t FOMO.
    2. A trade must have a clear entry, stop, target — and most importantly, a reason.
      “Gold is rising, can’t you see?” is not a reason. It’s FOMO.

    If You Want to Be a Real Trader, Remember This

    1. The market has two directions, even when it looks like it only has one.
    2. In aggressive trends, even my cat becomes a great trader.
    3. Every trade must have a clear reason. If it doesn’t, and you enter just because “it’s going up”, that’s FOMO — and we all saw what happened to crypto in 2021. People are still waiting for the mythical altcoin season, while some are still 70- 90% down on the bag
    4. We’re all geniuses after seeing the chart: “should’ve bought there, closed there…”
    5. The only real truth is in your equity — and mine is higher, even though I’ve been selling.
    6. I can guarantee there are gold bulls reading this right now who lost money on long positions over the past month.
    7. In the end, it all comes down to money management and timing.

    Conclusion:
    Trading isn’t about being bullish or bearish.
    It’s about being disciplined, timing and money management; the rest is can-can, and "I told you so"

    P.S. Once again, I’m looking to sell — and if it works out like my last five trades, that’s perfectly fine with me.
    At the club, they don’t ask whether I paid for my champagne with profits from buying or selling gold.
    🍾

    General Discussion

  • Login or register to search.
Powered by NodeBB Contributors
  • First post
    Last post
0
  • Categories
  • Recent
  • Tags
  • Popular
  • World
  • Users
  • Groups