Skip to content
  • Categories
  • Recent
  • Tags
  • Popular
  • World
  • Users
  • Groups
Collapse
Brand Logo
UDS UDS: $1.86
24h: 7.02%
Trade UDS
Gate.io
Gate.io
UDS / USDT
MEXC
MEXC
UDS / USDT
WEEX
WEEX
UDS / USDT
COINSTORE
COINSTORE
UDS / USDT
Biconomy.com
Biconomy.com
UDS / USDT
BingX
BingX
UDS / USDT
XT.COM
XT.COM
UDS / USDT
Uniswap v3
Uniswap v3
UDS / USDT
PancakeSwap v3
PancakeSwap v3
UDS / USDT

Earn up to 50 UDS per post

Post in Forum to earn rewards!

Learn more
UDS Right

Spin your Wheel of Fortune!

Earn or purchase spins to test your luck. Spin the Wheel of Fortune and win amazing prizes!

Spin now
Wheel of Fortune
selector
wheel
Spin

Paired Staking

Stake $UDS
APR icon Earn up to 50% APR
NFT icon Boost earnings with NFTs
Earn icon Play, HODL & earn more
Stake $UDS
Stake $UDS
UDS Left

Buy UDS!

Buy UDS with popular exchanges! Make purchases and claim rewards!

Buy UDS
UDS Right

Post in Forum to earn rewards!

UDS Rewards
Rewards for UDS holders
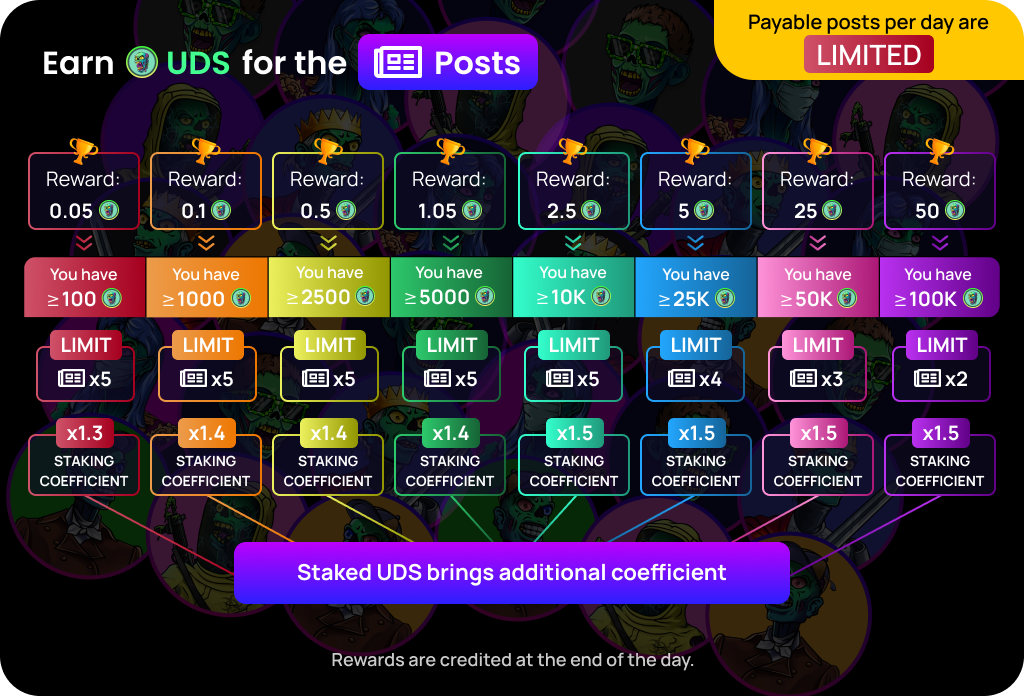
Rewards for UDS holders (per post)*
  • 100 - 999 UDS: 0.05 UDS
  • 1000 - 2499 UDS: 0.10 UDS
  • 2500 - 4999 UDS: 0.5 UDS
  • 5000 - 9999 UDS: 1.5 UDS
  • 10000 - 24999 UDS: 5 UDS
  • 25000 - 49999 UDS: 10 UDS
  • 50000 - 99 999 UDS: 25 UDS
  • 100 000 UDS or more: 50 UDS
*

Rewards are credited at the end of the day. Limited to 5 payable posts per day, 50 K holders - 3 posts per day, 100K holders - 2 posts per day. Staked UDS gives additional coefficient up to X1.5

kevin1K

kevin1

@kevin1
About
Posts
61
Topics
61
Shares
0
Groups
0
Followers
0
Following
0

Posts

Recent Best Controversial

  • 🤑 Ethereum Just Added $5B in Stablecoins — Here’s Why It Matters for Investors
    kevin1K kevin1

    019927ca-03a4-7475-ba5c-8659dc70dee2.webp
    Ethereum just hit a new all-time high in stablecoin supply — with more than $165 billion locked in. That’s not just a big number, it’s a signal: liquidity is flooding into Ethereum like never before.

    Here’s why this matters if you’re looking for your next crypto money play.

    💵 Stablecoins = Fresh Capital

    Ethereum now controls 57% of the global stablecoin market, dwarfing Tron (27%) and Solana (4%).

    More stablecoins = more dry powder. This is the liquidity that fuels DeFi, NFTs, staking, and yield farming.

    Think of it as billions of dollars parked on Ethereum, ready to be deployed.

    📈 Translation: More stablecoins = more activity = more demand for ETH gas = long-term bullish.

    🪙 Tokenized Gold & Treasuries = Institutional Validation

    Ethereum also hit an all-time high of $2.4B in tokenized gold.

    It owns 77% of all tokenized commodities (and 97% if you include Polygon).

    On top of that, Ethereum holds 70%+ of tokenized US Treasurys.

    Even Fidelity just launched a tokenized US Treasurys fund (FDIT) on Ethereum.

    💡 Institutions aren’t just “experimenting” — they’re literally bringing their biggest money-makers onchain.

    🚀 ETH Price Connection

    ETH is up 200% since April, peaking just under $5K.

    Corporate treasuries scooped up almost 4% of ETH supply in just 5 months.

    This trend isn’t retail hype — it’s deep, sticky institutional adoption.

    🧭 Investor Takeaway

    Ethereum is no longer “just” a smart contract chain. It’s becoming the backbone of digital dollars, digital gold, and even Treasurys.

    That means:
    ✅ ETH is positioned as the settlement layer for global finance.
    ✅ Stablecoin growth fuels constant demand for ETH gas.
    ✅ RWA tokenization (gold, bonds, funds) ties Ethereum directly to trillions in TradFi assets.

    🔑 Opportunity Play:

    Watch for dips under $4,300 as buy zones.

    Track RWA fund launches (Fidelity is just the start).

    Yield strategies around stablecoin lending & tokenized assets = double dip on growth + passive income.

    Airdrop and Ways to earn money

  • 💰 XRP’s Next Big Opportunity: Can Ripple Take On SWIFT?
    kevin1K kevin1

    01991ba2-5b6d-7cb3-95b8-7adcbb86c319.webp

    Ripple just won its multi-year battle against the SEC, and XRP now enjoys something almost no other crypto has: legal clarity in the US. That’s not just good news for lawyers — it could be the spark for XRP’s next major run. Here’s why.

    🌍 Why SWIFT Matters

    SWIFT is the backbone of global money transfers, handling 53M+ messages daily.

    But it’s slow (days, not seconds), expensive (fees everywhere), and unreliable (10% failure rate).

    Even with upgrades like ISO 20022, it’s still 1970s infrastructure patched for 2025.

    ⚡ Why Ripple Could Disrupt It

    XRP settles in seconds with near-zero fees.

    Blockchain rails = transparent + programmable.

    Banks and remittance firms already test-driving Ripple’s ledger.

    If Ripple captures even a small slice of SWIFT’s daily volume, XRP demand could surge.

    📈 The Money Angle

    XRP is up 400% over the past year, despite the lawsuit cloud.

    Now with the case closed, Ripple can chase US banks + global corridors without legal baggage.

    Institutions like the idea of stable, compliant rails — Ripple’s Ripple USD stablecoin fits right in.

    Imagine this: Even if Ripple grabs just 2–3% of SWIFT traffic, the volume funneled through XRP rails could dwarf current utility levels. That’s the kind of fundamental catalyst long-term traders look for.

    🚧 The Roadblocks (and Why They’re Still Opportunities)

    Banks don’t switch overnight — it can take 5–7 years to retool.

    Regulation is uneven worldwide, but the GENIUS Act is clearing the path.

    Perception risk: XRP still needs to prove liquidity and reliability at scale.

    But these challenges = time to accumulate before full adoption.

    🔑 Bottom Line

    Ripple isn’t promising to “replace SWIFT” tomorrow. But it doesn’t need to. The massive global payments pie is big enough that even partial adoption could send XRP higher.

    Opportunity play: Smart investors are watching Ripple’s banking partnerships, stablecoin rollout, and SWIFT corridors closely. Each new deal could be a buy signal before the market fully prices it in.

    Airdrop and Ways to earn money

  • 🚀 Ripple Beats SEC — But Can XRP Really Replace SWIFT?
    kevin1K kevin1

    01991ba2-5b6d-7cb3-95b8-7adcbb86c319.webp

    After nearly five years of courtroom drama, Ripple has finally ended its legal battle with the US SEC, bringing long-awaited legal clarity to XRP. Now the big question looms: can Ripple’s blockchain-based payments system take on the 50-year-old SWIFT network?

    💸 SWIFT: The Old Guard

    Founded in 1973, SWIFT handles 53M+ messages daily across 220 countries.

    But it’s slow (transactions can take days), costly (fees stack up), and fragile (1 in 10 fails, 1 in 20 settles late).

    Even after upgrades like ISO 20022, critics call it outdated XML-era tech.

    ⚡ Ripple’s Pitch

    Ripple offers:

    Faster settlements (seconds instead of days)

    Lower costs (fraction of traditional fees)

    Transparency via blockchain rails

    In fact, Ripple CEO Brad Garlinghouse once claimed his company was “taking over SWIFT” as banks and remittance providers signed onto the XRP Ledger.

    🛑 Why Ripple Hasn’t Replaced SWIFT Yet

    Regulation: The SEC lawsuit froze US adoption, though Ripple now enjoys rare legal clarity.

    Bank inertia: Every bank already “speaks SWIFT.” Replacing it means 5–7 years of retooling and hundreds of millions in costs — a major operational risk.

    Perceptions: Skepticism about XRP liquidity and crypto risk keeps traditional institutions cautious.

    As pseudonymous engineer Vincent Van Code put it:

    “SWIFT’s ubiquity is its moat, and breaking that network effect will take time.”

    🏦 The Path Forward

    Ripple exec Cassie Craddock says blockchain won’t replace legacy rails but will augment them, boosting interoperability.

    Stablecoins like Ripple USD are gaining traction because they feel familiar to banks and behave like digital cash.

    The US GENIUS Act is giving institutions confidence to adopt blockchain in a compliant way.

    🇺🇸 A New Political Climate

    With the SEC stepping back post-Trump’s election, Garlinghouse sees massive opportunity:

    “The Trump effect is profound... you’re gonna see that in the adoption of blockchain technologies.”

    Pulse of the market

  • 🐋 Bitcoin Whales Dump $12.7B, But Institutions Are Absorbing the Pressure
    kevin1K kevin1

    01992798-68e2-791b-b31c-b2aa48491f12.webp

    Bitcoin whales have sold more than 100,000 BTC — worth roughly $12.7 billion — over the past 30 days, marking the largest whale distribution since July 2022, according to on-chain data from CryptoQuant.

    🔻 Short-Term Pressure

    Whale reserves dropped by 114,920 BTC in a month, signaling risk aversion among large holders.

    This selling pressure pushed BTC below $108,000, creating volatility and liquidations.

    Analysts warn the trend may continue to weigh on price in the coming weeks.

    ⚖️ Whale vs. Institutions

    Despite the sell-off, institutional buyers and ETFs have stepped in as a structural counterbalance.

    “Institutional accumulation during the same period has helped stabilize the market,” said Nick Ruck of LVRG Research.

    This tug-of-war suggests whales may cap near-term upside, but corporate dip-buying could keep BTC resilient.

    📉 Whale Activity Slowing?

    The 7-day whale balance change peaked at +95,000 BTC on Sept. 3, the highest since March 2021.

    As of Sept. 6, weekly outflows slowed to 38,000 BTC, while BTC traded between $110K–$111K.

    📈 Bigger Picture Still Bullish

    Zooming out, Bitcoin has corrected just 13% from its mid-August ATH — a shallow pullback compared to past cycles.

    The 1-year SMA has nearly doubled from $52K last year to $94K today, and is expected to cross $100K in October, according to analyst Dave the wave.

    👉 Takeaway: Whales are cashing out, but institutions are quietly buying the dip. Short-term turbulence remains, but long-term metrics suggest Bitcoin’s bull trend is still intact.

    Pulse of the market

  • Bitcoin Rally Fades as Prices Nosedive. End of Bullish Cycle?
    kevin1K kevin1

    edd80d12-955b-45e4-a97b-0f42992a2f9a-image.png Technical analysis will tell you that maybe it’s time for a pullback. But then again, this is crypto. It’s the wild west, where predictions are polite suggestions at best. Here’s what we know about where we are.

    📉 Bitcoin Takes a Breather

    Bitcoin
    BTCUSD
    started the week on a quieter note, trading mostly sideways while altcoins decided to explore the downside a little more aggressively. After hitting a record high of $124,500 in mid-August, the world’s largest cryptocurrency has pulled back roughly 13%, currently hovering between $108,000 and $110,000.

    That’s still a big number, but the market mood has shifted from full-blown euphoria to cautious watching. And the question on everyone’s mind? Did we just top out or is there more room to the upside?

    🏛️ Politics, Tariffs, and Bitcoin’s Rally

    Crypto’s recent run-up didn’t happen in a vacuum. After the April dip – triggered by President Donald Trump’s sweeping global tariff announcements – Bitcoin bounced back hard.

    Traders quickly shrugged off the policy shock, betting that a crypto-friendly administration would eventually be good for business.

    And they weren’t wrong. Since late 2024, Bitcoin and co have been riding a bullish wave fueled by increased Treasury interest, ETF inflows, and a broader perception that digital assets are now mainstream.

    But with prices off their August highs, the question is whether the market still has the energy to keep pushing… or if gravity is about to kick in.

    📐 Technical Check: Bulls, Bears, and Battle Lines

    Let’s talk charts. At current levels, Bitcoin is sitting right in the middle of its long-term ascending channel – a key battleground between bulls and bears.

    1️⃣ Upside scenario: If Bitcoin can hold the line around current prices, the structure could accumulate to a potential breakout toward fresh highs. A sustained move above $112,000 could flip short-term momentum back in favor of the bulls.

    2️⃣ Trip south scenario: If the near-term support fails, there’s potential for $98,500 as the bears' next target. It’s a previous bottom hit on June 22.

    3️⃣ Deep south scenario: $92,000 could become the next support as it would represent the fourth inflection point of the ascending channel’s lower boundary. That is, if prices continue to drift lower at the same steady pace.

    4️⃣ Really deep south scenario: A steeper correction could drag Bitcoin all the way back to $75,000 – the key level last touched on April 7 (yes, it was the tariff mayhem). It’s the dip, which kicked off the current bull cycle so it’s something of a big deal.

    Adding to the caution, both the 50-day and 100-day moving averages are now sitting above current prices, suggesting that the upward momentum has cooled – at least for now.

    🔄 The Seasonal Side of Crypto

    Bitcoin’s price history has a rhythm, and for better or worse, crypto dances to seasonal vibes. Historically, late summer and early fall tend to bring volatility spikes – and often, corrections – as trading volumes thin out and liquidity gets patchy.

    The OG token isn’t the only one feeling the heat. Ether
    ETHUSD
    – which hit a record high of just under $5,000 on August 24 – has slipped roughly 11%. This isn’t necessarily a bad thing; corrections can reset overheated conditions and shake out weak hands (not you, diamond hands) before another leg higher.

    Still, with macro uncertainty looming, traders should expect choppier price action heading into the final quarter of 2025.

    📖 Technical Analysis: What to Make of It

    Technical analysis is built on one key assumption: history repeats itself. Traders look for continuation patterns, support and resistance levels, and indicators like moving averages to predict future price moves.

    But technical analysis doesn’t account for surprises (unless you go full meta and add the surprises to the natural order of events). Sudden regulatory actions, geopolitical shocks, or even a single whale unloading a massive position can blow up the cleanest technical setups.

    ✏️ Bottom Line

    The next few weeks will be key. If Bitcoin can reclaim momentum and punch above $112,000, the bulls could get back in control. But if we slide through $100,000 and lose $92,000, the conversation may shift toward deeper corrections and range trading, with a long-term bear target of $75,000.

    In the bigger picture, this pullback could just be part of Bitcoin’s usual rhythm: rally, correct, consolidate, repeat.

    Still, Bitcoin ETFs are booming and companies continue to load up on the crypto and jam it in their treasuries while the White House is working out crypto-friendly legislations.

    🏎️💨 Fast fact: Bitcoin has lost 80% of its value not once or twice but four times, only to recoup the losses and come back roaring to a new all-time high. What would an 80% drop look like? Going from $124,500 to $24,000.

    Off to you: WAGMI? Or NGMI? Share your thoughts in the comments!

    Hero Portfolio

  • SHOP - BULLISH SCENARIO since 12 MAY 2025
    kevin1K kevin1

    335b21d2-2a00-4bec-bb6a-4039a7c28b5d-image.png SHOP - CURRENT PRICE : 145.15

    SHOP is bullish as the share price is above 50-day EMA. Price action on 12 MAY 2025 is considered starting of bullish scenario because supported by several key indicators :
    Share price gap up
    Price broke out 50-day EMA
    Price moving above ICHIMOKU CLOUD
    RSI moving above 50

    From 1 August (near 50-day EMA support) to 6 August, the stock recorded a strong upward rally. Following this advance, prices entered a corrective phase and retraced approximately 50% of the prior upswing. According to Dow Theory, such a retracement is considered a normal and healthy correction within an ongoing uptrend. Retracements in the range of one-third to two-thirds of the prior move are typical, with the 50% level often serving as a natural equilibrium point where buyers re-enter the market. Sustaining above the 50% retracement level would reinforce the bullish structure, while a recovery from this zone could pave the way for a retest of the recent highs. However, a decisive break below the 61.8% retracement may imply weakening momentum and a deeper corrective phase.

    Take note that until now the share price is still above 50-day EMA and ICHIMOKU CLOUD while RSI also moving steadily above 50 level. There is also rising support line - strengthening bullish outlook.

    ENTRY PRICE : 141.00 - 145.50
    TARGET : 159.00 and 175.00
    SUPPORT : 50-day EMA (CUTLOSS below 50-day EMA on closing basis)

    Hero Portfolio

  • EUR/GBP Forming Ascending Triangle – Bullish Breakout Potential
    kevin1K kevin1

    793ffe55-0608-4bb4-8a6c-691a9e25c0da-image.png EUR/GBP on the daily timeframe is showing strong bullish structure. After breaking out of the descending channel, price has respected the upward trendline and is now consolidating inside an ascending triangle pattern.

    Support zone holding around 0.8600 – 0.8620

    Upward trendline acting as dynamic support

    A breakout above the triangle resistance could open the way toward 0.8750 – 0.8800

    If support fails, price may retest the lower zone before continuing higher

    📌 This setup suggests bullish continuation if the ascending triangle confirms with breakout and volume.

    Always apply proper risk management. This analysis is for educational purposes only, not financial advice.

    Trading

  • BITCOIN → Sale on positive news? What to expect? 100K or 130K?
    kevin1K kevin1

    EtD1URkW.png
    BTCUSDT.P
    unsuccessfully ended another attempt to break through the 112K-113K zone. The positive background (NFP) did not affect the price, and a bearish setup formed on D1..

    D1 is forming a pin-bar relative to the strong resistance zone of 112K - 113K, positive news is quickly sold off, and the price, rebounding from the resistance of the trading range, closes near the bearish trigger of 110500. Bitcoin looks quite uncertain as it faces selling pressure in the 112K-113K zone. The price cannot consolidate above this area despite the previously broken correction resistance. There is logic in this maneuver... The market is betting on a more than 90% chance of interest rate cuts, and by that point, the price of Bitcoin may fall to the maximum permissible limits before further growth. Areas of interest may be 107K - 105K - 100K

    Resistance levels: 111.9K, 113.3K, 117K
    Support levels: 110.5K, 107.4K, 105.0K

    A breakdown of the 110.5K support could trigger further sell-offs towards the support of the key trading range. Within the current downward cycle, the price may well test 105,000, which is a fairly strong liquidity zone. The fundamental background is positive, and the current sell-off may be manipulative movement before the emergence of a bullish driver...

    Trading

  • Pudgy Penguins Game Cracks App Store Top 10, But $PENGU Token Keeps Slipping 🐧📉🎮
    kevin1K kevin1

    0198f781-b93b-7dd3-9e51-b41b57d44ec8.webp

    The Pudgy Penguins franchise is soaring in mainstream visibility — but its token isn’t feeling the love.

    🎮 Pudgy Party Game Launch

    New battle royale game “Pudgy Party” launched on iOS & Android.

    🚀 50,000+ downloads on Google Play.

    🏆 Cracked the Top 10 most downloaded games on Apple’s App Store.

    📉 Token Price Action

    $PENGU fell ~4% on Friday, despite the game’s strong debut.

    Over the past 30 days, the token is down 20%+ (CoinMarketCap).

    Reflects wider NFT market slump → Bored Ape Yacht Club (–11%), Doodles (double-digit drop).

    🌍 Cultural Appeal vs. Market Reality

    Pudgy Penguins has become a cross-over brand:

    NFTs + trading cards + plush toys + video games.

    Strong resonance beyond Web3 → kids, collectors, and mainstream gamers.

    Yet token value remains tied to NFT market cycles and broader ETH price action.

    📊 The NFT Market Backdrop

    ETH dropped from $4,957 ATH → $4,397, dragging NFT valuations lower.

    NFT market cap:

    $9.3B in early August → now $7.4B.

    Exception: CryptoPunks +3% in August, showing relative resilience among blue chips.

    🧩 The Takeaway

    Pudgy Penguins may be winning the mainstream adoption game, but token holders are feeling the sting of the broader NFT downturn.

    💬 Question: Does Pudgy’s cultural brand expansion make $PENGU a long-term play — or will it always remain chained to ETH’s price swings and NFT market sentiment?

    Beyond Blockchain

  • America’s New “High-Speed” Trains Are Slower Than the Old Ones 🚄🇺🇸
    kevin1K kevin1

    leonardo.osnova.webp

    The U.S. has finally rolled out its long-awaited NextGen Acela high-speed trains — but there’s a catch: for now, they run as slow as (or slower than) the old models, thanks to outdated rail infrastructure.

    🚆 What’s Happening

    Amtrak has deployed five NextGen Acela trains on the Washington–Boston route.

    Trains are capable of hitting 160 mph (257 km/h) — about 10 mph faster than the previous Acela.

    Reality check: according to WSJ, two trains will actually take longer than their predecessors.

    NextGen Acela trip time: 7h 05m

    Old Acela average: 6h 56m

    🛤️ Why So Slow?

    Amtrak says the limiting factor is infrastructure, not the trains:

    Aging tracks, switches, signals, and overhead power lines.

    Shared lines with commuter and freight trains — instead of dedicated high-speed rail corridors.

    Until upgrades are complete, the NextGen Acela can’t reach its full potential.

    📅 What’s Next

    Amtrak plans to roll out 28 new Acela trains within two years, phasing out the old fleet.

    Infrastructure modernization is scheduled in the coming years to boost speed and reliability.

    Fun fact: The launch was originally slated for 2021, but testing issues and the pandemic pushed it back.

    🧩 The Takeaway

    The NextGen Acela shows the U.S. can build faster trains — but without modernized infrastructure, they’re stuck crawling like the old ones.

    💬 Question: Should the U.S. prioritize faster trains first or new tracks first — or is this proof that both need to happen together?

    Beyond Blockchain

  • Elon Musk’s Lawyer to Chair $200M Dogecoin Treasury Company 🐕💵
    kevin1K kevin1

    Crypto-DOGE-Coin.webp

    A new publicly traded Dogecoin treasury vehicle is being pitched to investors, with Elon Musk’s longtime attorney Alex Spiro slated as chairman, according to Fortune.

    📊 The Plan

    Target raise: $200M.

    Structure: A public company holding Dogecoin on its balance sheet.

    Goal: Give investors stock-market exposure to DOGE without direct ownership.

    Backed by: House of Doge, the corporate entity launched by the Dogecoin Foundation in Miami earlier this year.

    Status: Still at pitch stage — structure and launch timing TBD.

    👤 Who’s Leading?

    Alex Spiro (Quinn Emanuel partner) → known for representing Elon Musk, Jay-Z, Alec Baldwin.

    His name is appearing in investor materials and conversations as incoming chairman.

    Notably, Spiro also defended Musk in the Dogecoin manipulation lawsuit, which was dismissed in late 2024.

    🐕 The Rise of Dogecoin Treasury Companies

    2025 has seen a wave of public firms reposition as crypto treasuries, some explicitly focused on DOGE:

    Neptune Digital Assets (Canada): acquired 1M DOGE at $0.37 avg + added 20 BTC to reserves.

    Bit Origin (Nasdaq): secured $500M financing to build a Dogecoin-centric treasury — the first U.S.-listed company to do so.

    Tesla: still holds Dogecoin (size undisclosed), accepts DOGE for merch since 2022.

    🐕‍🦺 Musk’s Long DOGE History

    2019: Musk calls Dogecoin “my fav cryptocurrency” → price surge.

    2021: SNL appearance, joking DOGE is a “hustle” → sharp selloff.

    Multiple tweets have been market-moving events, leading to regulator scrutiny.

    Lawsuit alleging manipulation dismissed, with Spiro leading the defense.

    🧩 The Takeaway

    If the deal closes, this would mark the first public DOGE treasury vehicle with Musk-world fingerprints.

    🚀 Bull case: Institutionalized Dogecoin exposure could legitimize DOGE as a treasury asset, much like Bitcoin before it.

    ⚠️ Bear case: DOGE remains a memecoin with limited adoption, making a $200M treasury play highly speculative.

    💬 Question: Is this the moment Dogecoin graduates from meme to treasury asset, or just another Musk-adjacent hype cycle?

    Airdrop and Ways to earn money

  • Tether Revises USDT Phase-Out: No Freezing, Just No More Issuance 🔄💵
    kevin1K kevin1

    0198f875-43a3-7d3d-b0bb-4a8994dceef6.webp
    Stablecoin giant Tether has adjusted its plan to sunset USDT support on five blockchains, saying it will no longer freeze contracts, but will stop minting and redemption on these networks.

    🔧 What Changed

    Original plan: fully end support (including freezing contracts) on Omni Layer, Bitcoin Cash SLP, Kusama, EOS, Algorand starting Sept. 1.

    New plan (after community pushback):

    ✅ Smart contracts remain active → tokens still transferable.

    ❌ No new issuance or redemption → tokens on these chains become “unsupported.”

    Tether: “Following feedback from the communities of these discontinued blockchains, Tether has revised this approach and will not freeze the smart contracts.”

    🌐 Why It Matters

    This reflects Tether’s selective focus:

    Strong ecosystems with developer activity + scalability = continued support (e.g., Ethereum, Tron, BNB Chain).

    Niche or declining L1s = phased out.

    📊 USDT supply by chain (DeFiLlama):

    Tron: $80.9B

    Ethereum: $72.4B

    BNB Chain: $6.78B

    Omni Layer: $82.9M

    EOS: $4.2M

    Others (Algorand, Kusama, BCH SLP): < $1M each

    Omni Layer, once the birthplace of USDT, is the most affected — but its circulation is now a fraction of Tron/Ethereum dominance.

    🏦 Stablecoins in the Big Picture

    USDT market cap: $167.4B

    USDC market cap: $71.5B

    Global stablecoin market: $285.9B (CoinGecko)

    U.S. Treasury projects the sector could hit $2T by 2028, especially with regulatory tailwinds.

    Notably, the GENIUS Act (signed July 2025) is designed to promote dollar-pegged stablecoins, strengthening USD dominance in digital markets.

    🧩 The Takeaway

    Tether isn’t abandoning legacy chains outright — but it’s signaling a clear priority:

    Focus on networks with liquidity, adoption, and compliance runway.

    Allow unsupported chains to fade without breaking existing users.

    💬 Do you think leaving “unsupported” tokens circulating (but not redeemable) creates long-term risks for users, or is it the right compromise to maintain trust in Tether’s brand?

    Airdrop and Ways to earn money

  • El Salvador Moves Bitcoin to 14 Wallets Over Quantum Security Concerns 🛰️🔐
    kevin1K kevin1

    0198f938-f623-74ec-9148-8e6275304049.webp

    El Salvador has quietly redistributed its Bitcoin reserves into 14 separate wallet addresses — a move its Bitcoin Office says is aimed at reducing potential risks from future quantum computing attacks.

    🪙 What Changed

    🇸🇻 El Salvador previously held 6,274 BTC (~$678M) in a single address.

    On Friday, those funds were split into 14 new wallets, each capped at 500 BTC.

    The Bitcoin Office explained: once funds are spent, their public keys are revealed, making them theoretically vulnerable to quantum cracking down the line.

    ⚡ Why Quantum Matters (Eventually)

    Project Eleven estimates 6M+ BTC (~$650B) could be at risk if elliptic curve cryptography (ECC) were broken.

    But for now, the risk is low: no quantum computer has cracked even a 3-bit key, far from Bitcoin’s 256-bit standard.

    Michael Saylor (MicroStrategy) dismissed the panic in June:

    “If quantum becomes real, Bitcoin just upgrades — like Microsoft, Google, or the US government do with software.”

    📉 IMF Tensions Still in Play

    An IMF report in July claimed El Salvador hasn’t bought new BTC since February, raising doubts over its official narrative.

    Bukele’s Bitcoin Office continues to post about ongoing purchases, but hasn’t directly addressed IMF claims.

    El Salvador previously secured a $1.4B IMF funding package in late 2024, conditional on scaling back Bitcoin initiatives — a source of ongoing friction.

    🧩 The Takeaway

    El Salvador’s quantum-proofing move may be more about optics than urgent necessity, but it highlights:

    🌍 Nation-states now treating Bitcoin custody with sovereign-level security strategies.

    ⚡ Quantum remains a future concern, not an immediate threat.

    💸 IMF disputes suggest El Salvador’s Bitcoin experiment is still politically and financially contested.

    💬 Do you think El Salvador’s move is forward-thinking risk management, or just a symbolic flex to signal long-term conviction in BTC?

    Crypto Lifestyle

  • Bitcoin Slides to $108K as Whales Dump and Macro Jitters Weigh In 🐋📉
    kevin1K kevin1

    0198f65c-6834-753a-9b48-cfd9b131536a.webp

    Key Points:

    🔻 Bitcoin slips to $108,489, hitting multiweek lows after Wall Street’s open.

    🐳 Heavy whale selling on Binance sparks fresh downside.

    💥 Nearly $540M liquidated across crypto in 24 hours.

    📊 Bulls eye RSI divergence as a potential reversal signal.

    🏦 Fed’s inflation gauge meets expectations, but September payrolls could shake up rate cut bets.

    🐋 Whale Selling Drags BTC Lower

    BTC/USD shed ~4% Friday, tumbling to its lowest since July 8.

    Whale distribution on Binance piled pressure on the order books.

    CoinGlass data: $540M liquidations in 24 hours.

    Traders see BTC sitting in a key reversal zone.

    “Right on top of the previous range & consolidation area.” — Daan Crypto Trades

    📉 Technical Outlook: RSI Divergence Hope

    Despite the slump, some see light at the end of the tunnel:

    Four-hour RSI shows bullish divergence (higher lows in RSI vs. lower price lows).

    Analyst Javon Marks: BTC could bounce +15% → $123K if divergence plays out.

    But for now, BTC must reclaim $112K short term, and $114K for a stronger weekly close.

    🏦 Macro Pressure: Fed in Focus

    September = historically BTC’s weakest month. 📆

    PCE Index (Fed’s favored inflation gauge) came in line, showing signs of rebound.

    CME FedWatch: odds still favor a September rate cut.

    ⚠️ Mosaic Asset warns: strong payrolls next week could jeopardize the cut.

    🧩 The Takeaway

    BTC is in a tug-of-war:

    Negative drivers: whale sell-offs, weak seasonality, macro uncertainty.

    Positive drivers: RSI divergence, rate cut expectations, possible reversal setup.

    💬 Question: Are we heading for a flush toward $100K before bouncing — or will RSI divergences prove to be the springboard for a new leg higher?

    Pulse of the market

  • Ether ETFs and Corporate Treasuries Fuel $ETH’s Biggest Institutional Revival Yet 📈🔥
    kevin1K kevin1

    0198f629-c712-7af0-905d-07b91530559a.webp

    Ethereum is back in the spotlight — and this time, institutions are driving the rally.

    💰 ETF & Treasury Inflows Surge

    ETH ETFs (U.S.) have grown steadily since launching in July 2024.

    August inflows surged 44%, from $9.5B → $13.7B (SoSoValue).

    Meanwhile, corporate treasuries now hold 4.4M ETH (~3.7% of supply), worth $19.18B.

    “Treasury companies are a massive buyer… They won’t sell. So, yes, the impact will stay.” — Geoffrey Kendrick, Standard Chartered

    📊 Price Impact

    ETH climbed 27% in August, from $3,406 → $4,316.

    Renewed institutional demand is reversing a long stretch of underperformance vs. BTC.

    Analysts point to regulatory clarity (e.g., Genius Act) making ETH more attractive as a settlement layer.

    🔧 Ethereum Roadmap: Inflection Point

    Ethereum’s fundamentals are also strengthening — and the next upgrades could be game-changing:

    Pectra (May 2025): expanded validator caps + account abstraction.

    Fusaka (Nov 5, 2025): implements PeerDAS → lowers node workloads & boosts data availability.

    EigenLayer restaking + L2 rollup growth → generating real revenues and attracting dev talent back to ETH.

    ⚠️ The Catch: Revenues Lagging

    Despite institutional love, Ethereum’s protocol revenues are modest:

    ETH fees (last 30 days): $41.9M

    Tron fees (same period): $433.9M

    So while ETH is regaining mindshare, revenue-to-valuation metrics still lag peers.

    🧩 The Takeaway

    Ethereum’s ETF & treasury adoption is turning it into a legit institutional asset, not just “digital gas.”
    But the real question:

    Can ETH’s roadmap upgrades and restaking economy turn hype into sustainable revenue?

    Or will faster-moving chains keep stealing usage, even as institutions pile into ETH?

    💬 Are we watching the start of a multi-year ETH supercycle, or just another rotation before attention swings back to BTC and newer chains?

    Pulse of the market

  • Nvidia Shares Maintain Bearish Bias Near $170
    kevin1K kevin1

    ed9f015c-8243-4ae2-abc5-24e7b57bbda2-image.png
    Over the past three trading sessions, Nvidia’s shares have posted a sharp decline, accumulating losses of more than 3% in the short term. For now, the emerging selling bias around the stock remains in place, as the market fears a potential overheating of the artificial intelligence industry. Added to this is the anticipation of the company’s results on August 27, which may show difficulties in revenue, mainly due to concerns that sales in China have weakened in recent months amid the intensifying trade war. Earnings per share are expected to come in around $0.94, but uncertainty remains as to whether this figure can hold given possible performance challenges. As long as this uncertainty persists, selling pressure on the stock could remain in the short term.

    Uptrend Channel at Risk

    Recent sessions have shown a clear shift in the bullish outlook that Nvidia had been sustaining in prior weeks. A significant bearish correction has emerged, halting the advance of the short-term uptrend channel and leading to a breakdown of its lower boundary. As long as selling pressure continues, this previous channel may lose relevance and give way to a broader bearish scenario, provided the bearish bias remains dominant.

    Technical Indicators

    RSI: the RSI line has begun to show a downward slope, now approaching the neutral 50 level. If it breaks below this threshold, selling momentum could become dominant in the short term, paving the way for stronger bearish pressure on the chart in the upcoming sessions.

    MACD: the MACD histogram is currently moving below the 0 line, reflecting that short-term moving averages have entered a sustained bearish territory. If the histogram continues to decline, selling pressure is likely to strengthen further in the short term.

    Key Levels to Watch:

    $184 – Main Resistance: corresponds to the area of recent highs. A sustained recovery above this level could reactivate a bullish bias and bring back strength to the uptrend channel.
    
    $173 – Near-Term Support: current congestion zone of recent weeks and the most immediate barrier. A sustained move below this level could trigger a stronger bearish bias in the short term.
    
    $162 – Crucial Support: aligned with the 23.6% Fibonacci retracement. A decisive break below this level would confirm a bearish structural shift, opening the door to a new selling trend in the short term.
    
    Hero Portfolio

  • Correlation Traps: When Diversification Isn’t Diversifying
    kevin1K kevin1

    6fa185ff-4154-4f00-ac26-ffb7589ec975-image.png
    You thought you were diversified. You had tech, energy, crypto, gold — a little bit of everything. Then a single headline nuked your entire portfolio in one day. Welcome to the sneaky world of correlation traps.

    🧩 The Diversification Myth

    Everyone loves to brag about their diversified portfolio. Some Tesla TSLA here, Rocket Lab RKLB there, maybe sprinkle in some Solana SOLUSD “for balance.”

    But if your carefully curated mix of assets moves in the same direction every time Powell says “Good afternoon” at a Fed event… are you really diversified? Or are you just collecting different-shaped eggs in the same basket?

    This is the correlation trap — the illusion of safety when your assets are secretly plotting against you. On paper, your portfolio says “hedged.” In practice, one bad CPI USCPI print, a tariff tweet, or an AI bubble hiccup can torch your entire P&L statement for the month.

    And it works both ways. When Powell signals cuts, everything rallies: stocks, crypto, commodities, even meme ETFs. Suddenly, your “balanced” portfolio becomes a leveraged bet on a single narrative.

    📉 Positive Correlation = Double Trouble

    Correlation measures how two assets move relative to each other. Positive correlation means they tend to move together. That sounds fine on the upside — everyone’s a genius in bull markets. But when the markets get stressed, it doesn’t really matter if you’re holding traditional stocks or crypto assets.

    Here's an example. March 2020. The S&P 500 SPX cratered. Bitcoin BTCUSD lost more than half of its value in a week. Gold XAUUSD dipped. Even safe-haven treasury ETFs had a panic moment. When markets really go risk-off, assets that are usually uncorrelated can suddenly drop in sync.

    Why does this happen? Herd behavior, mostly. When traders, funds, and algos all unwind positions at once, correlations spike. In times of panic, cash is king.

    🛡️ Negative Correlation = Your Actual Friend

    True diversification comes from mixing assets with low or negative correlation. Historically, think equities vs. treasuries, or stocks vs. gold. When risk assets like stocks get wrecked, safe-haven assets like gold often move up to soften the blow.

    But even these aren’t bulletproof anymore. Rising inflation, aggressive tariff broadside, and geopolitical headlines can disrupt traditional correlations. Traders relying on “old rules” learn quickly that markets evolve, and yesterday’s safe havens don’t always save you today.

    Traders often assume “low correlation” equals “zero risk” or “perfect hedge.” Not really. Low correlation can vanish during high-volatility events — exactly when you need it the most.

    Correlation creep is real — and unless you check, you could be risking more than you think.

    🧠 Trading Psychology Meets Correlation

    Correlation traps aren’t just technical — they can mess with your thinking. Traders often overestimate how diversified they are, which breeds overconfidence. You assume your downside is limited… until a risk event wipes you out across positions you thought were independent.

    The result? Revenge trading. Over-sizing. Ignoring stop-losses. The correlation trap becomes a psychological spiral if you don’t plan your true exposure correctly.

    🛠️ Avoiding the Trap: Practical Moves That Work

    Run the numbers. You’ve built out a perfect portfolio? Check where your picks are coming from and where they fit using the TradingView Heatmaps and Screeners.
    
    Diversify by driver, not ticker. If multiple assets react to the same narrative, you’re likely not truly diversified.
    
    Add true hedges. Bonds, gold, cash, and volatility products can help — but only if you size them correctly.
    
    Watch cross-asset flows. Use correlations between equities, commodities, FX, and crypto to spot when risk is clustering.
    

    The key takeaway? Diversification isn’t about owning “a little of everything.” It’s about owning different risk exposures.

    👉 Bottom Line

    Diversification fails when you mistake quantity for quality. Five correlated trades don’t make you hedged; they make you levered without you knowing it.

    Correlation traps creep up quietly, especially during euphoric rallies when every chart goes up together. But when sentiment flips — and it does flip — you find out real quickly what’s actually diversified and what isn’t.

    Next time someone brags about holding “uncorrelated” assets, ask them one question: “Did they all move the same way on the last CPI print?” If the answer’s yes, maybe it’s time to rethink what diversification really means.

    Off to you: How do you balance your portfolio? Or maybe you’re not after diversification and instead you’re chasing concentration? Share your approach in the comments!

    Hero Portfolio

  • GOLD Quick Sell-Off Following Resistance Rejection
    kevin1K kevin1

    7413ee86-30c3-40b8-b1b8-2e81da25382d-image.png
    The price perfectly fulfilled my previous idea. XAUUSD is approaching the 3,430 resistance zone following a strong upward leg, showing early signs of exhaustion. The chart structure is forming within an upward channel but facing strong rejection at the red trendline resistance. If sellers maintain pressure, a decline toward 3,386–3,360 support becomes the primary scenario. Broader context suggests bearish momentum could strengthen if this breakdown accelerates since the market at key resistance.

    📉 Key Levels

    Sell trigger: Rejection from 3,430 resistance
    Sell zone: 3,430–3,435 ideal short entry region
    Target: 3,386 → 3,360 downside objective
    Invalidation: Breakout above 3,440 resistance
    

    💡 Risks

    Unexpected weakness in USD could push gold higher instead of lower.
    Safe-haven demand from geopolitical or macro shocks may boost gold.
    Weak economic data Core PCE Price Index.
    
    If this idea resonates with you or you have your own opinion, traders, hit the comments. I’m excited to read your thoughts!
    
    Trading

  • Bitcoin – Next Week Outlook: Liquidity Sweep Then Gap Fill
    kevin1K kevin1

    7793ebc5-9aee-4ad7-a15c-e1d705f250dd-image.png
    Bitcoin has been trading inside a broader downtrend, with repeated rejections at key resistance levels confirming bearish pressure. Recently, we saw price reject strongly at a 4H resistance zone, which set the stage for another leg down. However, before extending lower, there is still an unfilled CME gap above, and history shows that these gaps are often targeted before the market makes its next decisive move.

    Liquidity Sweep
    The most recent drop into the 108,500 zone appears to have created a potential liquidity sweep. Price dipped below a short-term low, likely grabbing stop losses and inducing traders into shorts, which could fuel a reversal back upward. This kind of move often signals accumulation before the market retraces higher.

    CME Gap Dynamics
    The CME gap between 114,000 and 116,000 remains unfilled, making it a strong magnet for price. Bitcoin has a clear tendency to revisit and fill these inefficiencies, and until that gap is resolved, I am leaning toward another upward push. The gap aligns with the rejection area from the previous resistance, so it would be a logical point for price to revisit before resuming the downward move.

    Short-Term Scenarios
    If Bitcoin holds above the recent liquidity sweep and builds strength on lower timeframes, I expect a climb back toward the CME gap. Once that gap is filled, the reaction from 115,000–116,000 will be key. If sellers defend that level again, the market could set up for another decline, targeting the lows around 109,000 and potentially lower. On the other hand, a clean break and acceptance above 116,000 would challenge the bearish bias, but for now that is less likely given the trend context.

    Expectations and Targets
    The primary expectation is for Bitcoin to rally back into the 114,000–116,000 zone to fill the CME gap. From there, I anticipate sellers to step in again, driving price back down toward 110,000 and possibly retesting the sweep lows. This sequence of liquidity sweep, gap fill, and bearish continuation would align with the current market structure.

    Conclusion
    In summary, Bitcoin has swept liquidity at the lows and now has unfinished business above with the CME gap. A move up into that gap looks probable before we see continuation to the downside. As long as price respects the 4H resistance zone after the gap is filled, I will maintain a bearish outlook with eyes on new lows afterward.

    Trading

  • 🕵️‍♂️ Case File: The Return of James Wynn — High Leverage, Higher Stakes
    kevin1K kevin1

    0198d5af-bf7e-7094-8be3-7215b4d44c10.png

    James Wynn, the trader infamous for riding — and crashing — nine-digit waves of leverage, is back in the arena. This time? A 25x ETH long.

    📊 The Setup

    Margin: $5,568

    Position: 29.3 ETH ($139,215)

    Entry: $4,239

    Unrealized PnL: +$14,888 (+267%)

    Leverage: maxed out at 110% margin usage

    But Wynn isn’t stopping there. He’s also holding a 10x Dogecoin long worth $206K, currently bleeding ~$1,886.

    All told, Wynn’s exposure is $345K on just $26.6K equity. One wrong candle, and the liquidation sirens could sing again.

    💀 The Backstory

    May 30: Wynn’s $100M BTC long liquidated.

    June 5: Another $25M loss.

    His X account vanished with a final bio update: “broke.”

    July 15: He reappeared swinging — 40x BTC long, 10x PEPE long.

    Now, as ETH rips past $4,860 on Powell’s dovish whisper and ETF inflows, Wynn’s gambling style is back in focus.

    ⚖️ The Detective’s Question
    Is Wynn the quintessential degen, chasing dopamine hits on borrowed coins? Or is he the canary in the leverage mine, showing just how fragile this ETH rally could be if whales decide to squeeze?

    Because let’s face it — one slip, and the same “big players” he accused of hunting his stops might smell blood again.

    🚨 Clue for the file: Wynn’s positions aren’t just about Wynn. With ETH treasuries swelling and ETFs pulling billions, a degen lever-longer like him could become a convenient liquidity meal in the bigger game.

    Hero Portfolio

Powered by NodeBB Contributors
  • First post
    Last post
0
  • Categories
  • Recent
  • Tags
  • Popular
  • World
  • Users
  • Groups