#Gold- Posted Yeterday on 13-Oct-2025
 All Targets Reached

—————————————————————
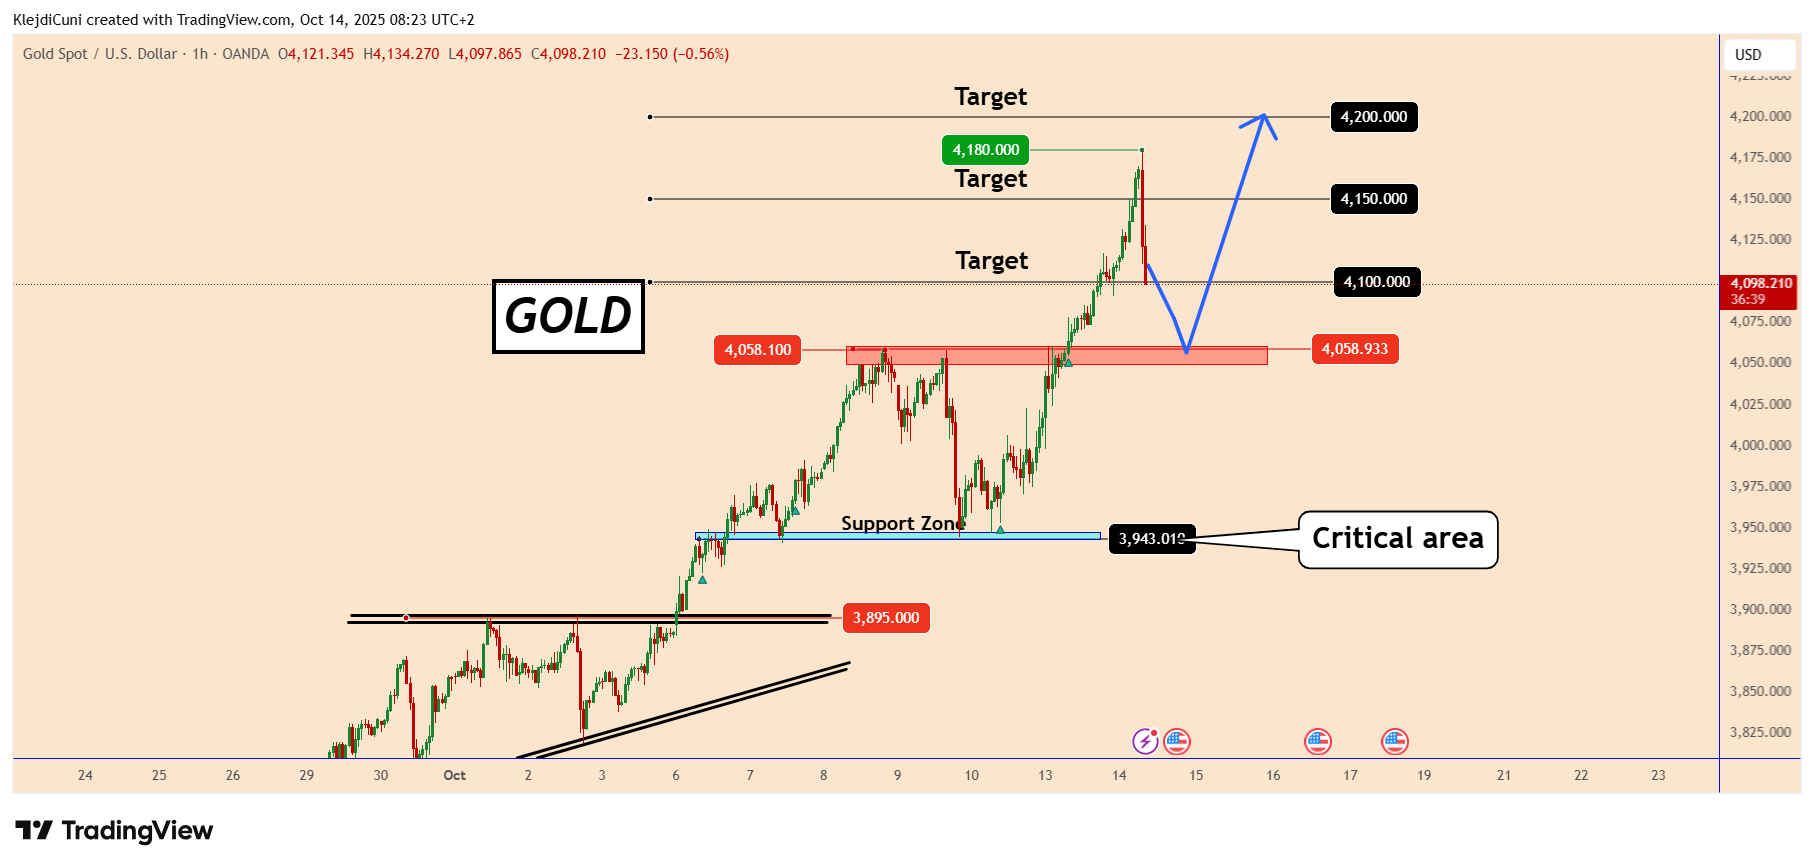
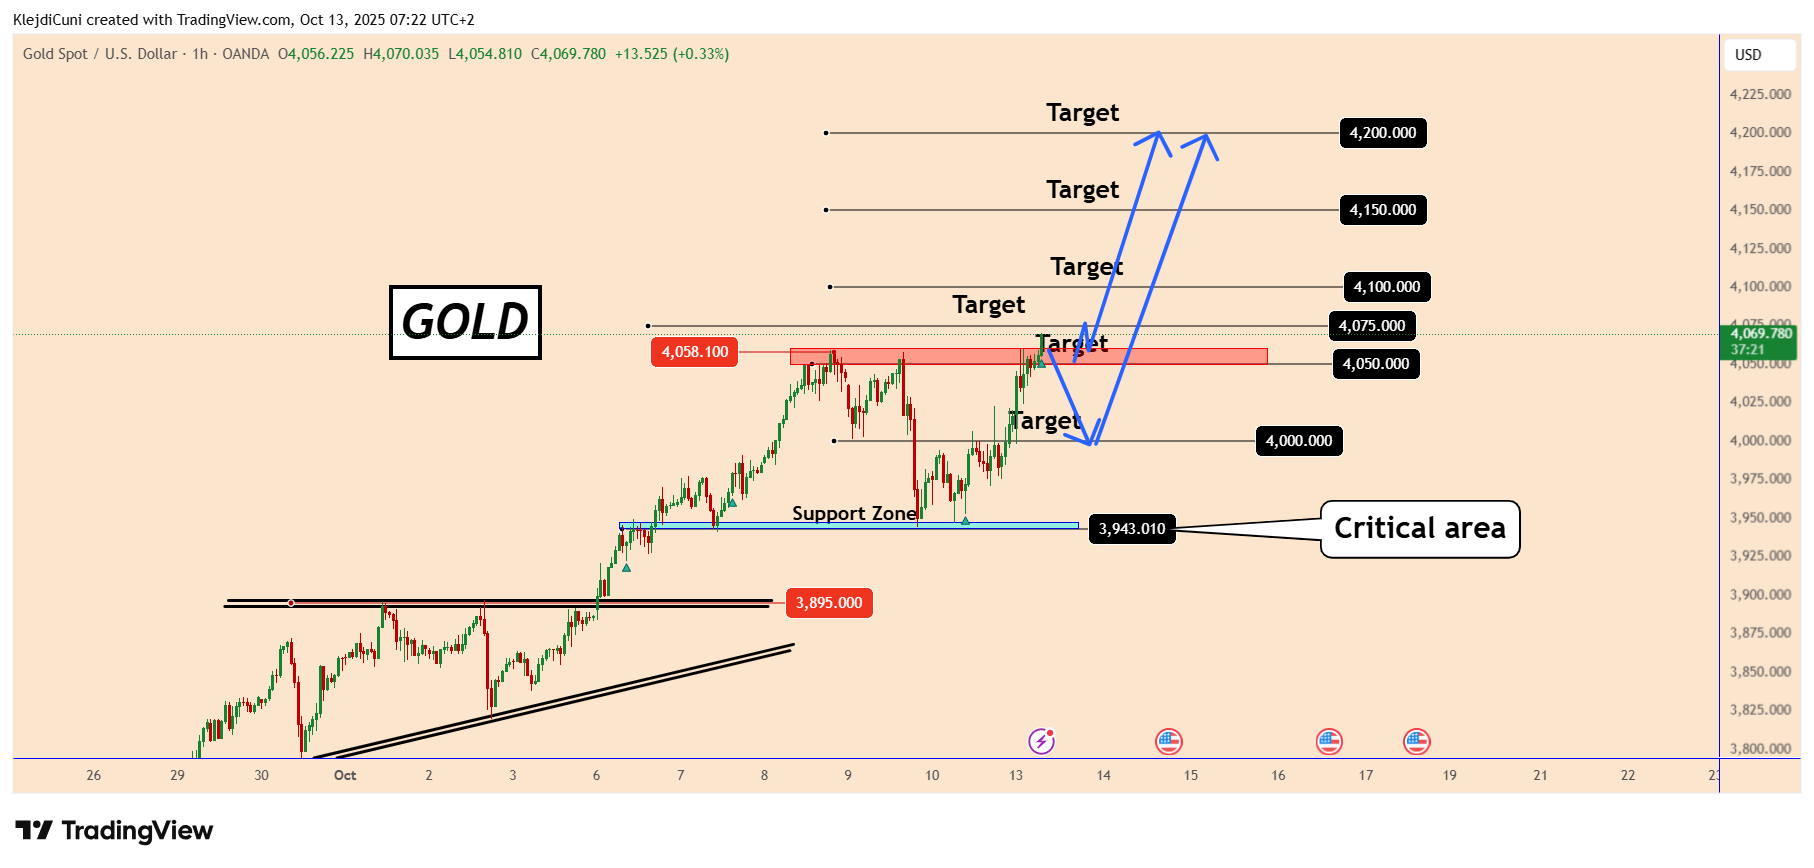
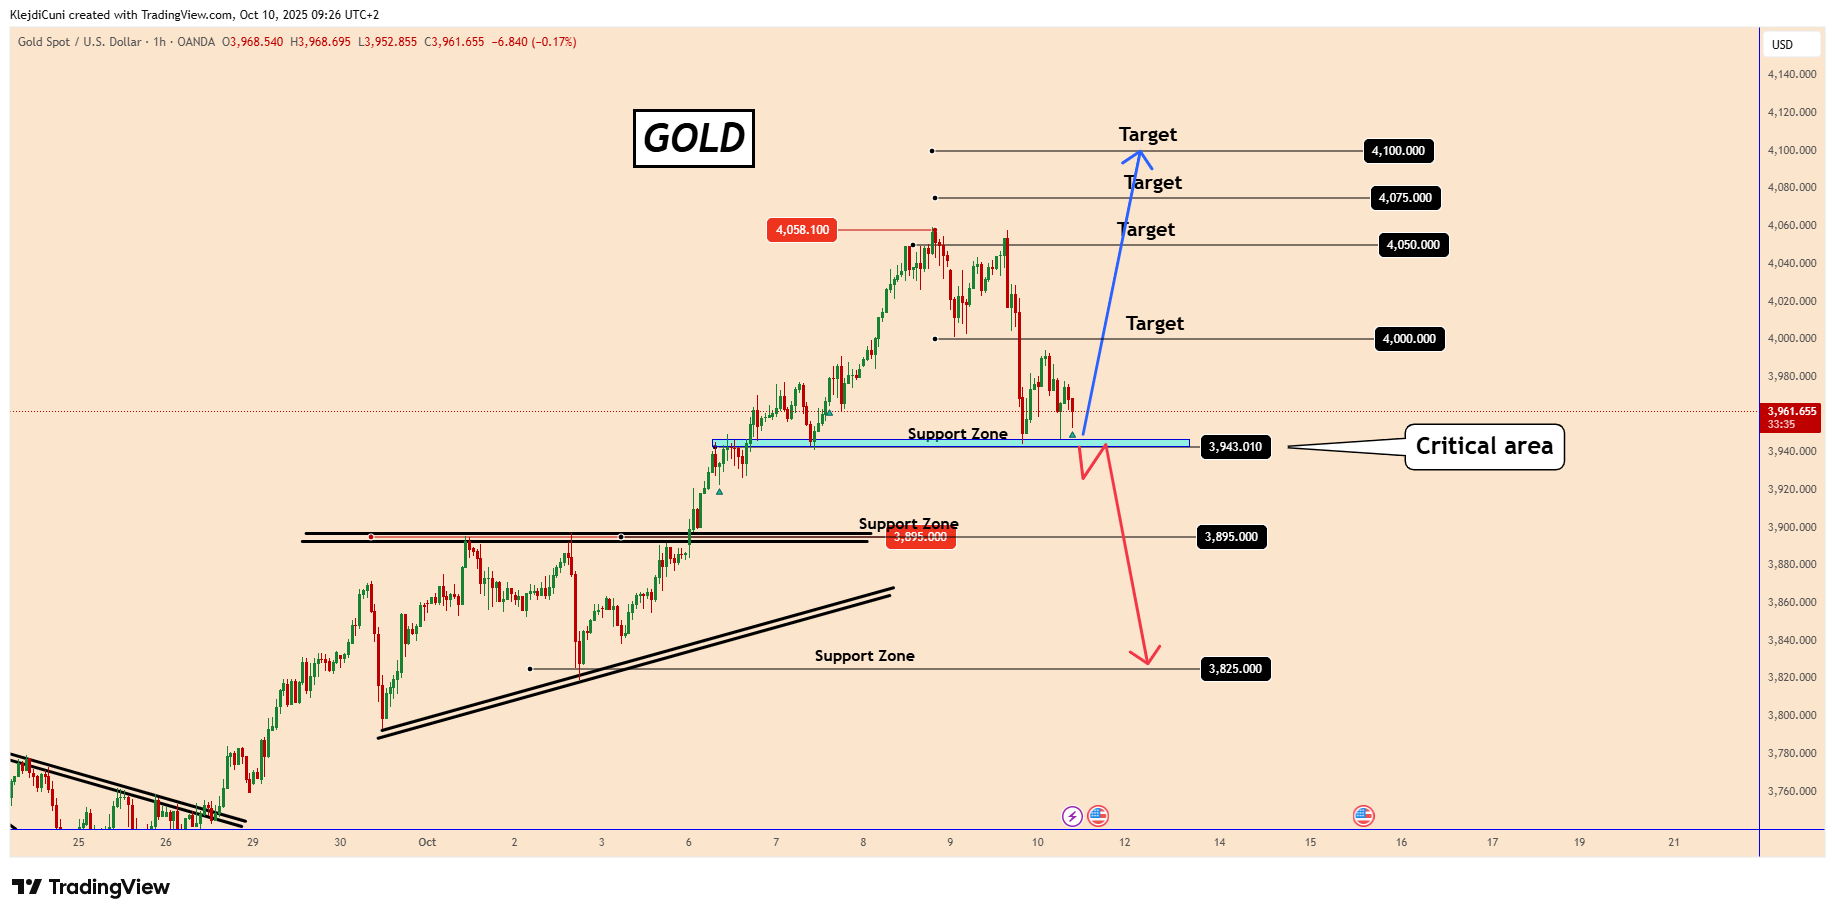
GOLD Price Outlook
From our analysis gold reached 4180 easily from 4063 at a time that the U.S Market yesterday was closed.
Probably it can reach 4180 or 4200 today but again should be difficult. With the opening of the U.S Market the volume should grow and probably we have to wait for a clear picture again.
It's possible that GOLD can test 4060 again before it moves up again.
 ️PS: Please support with a like or comment if you find this analysis useful for your trading day
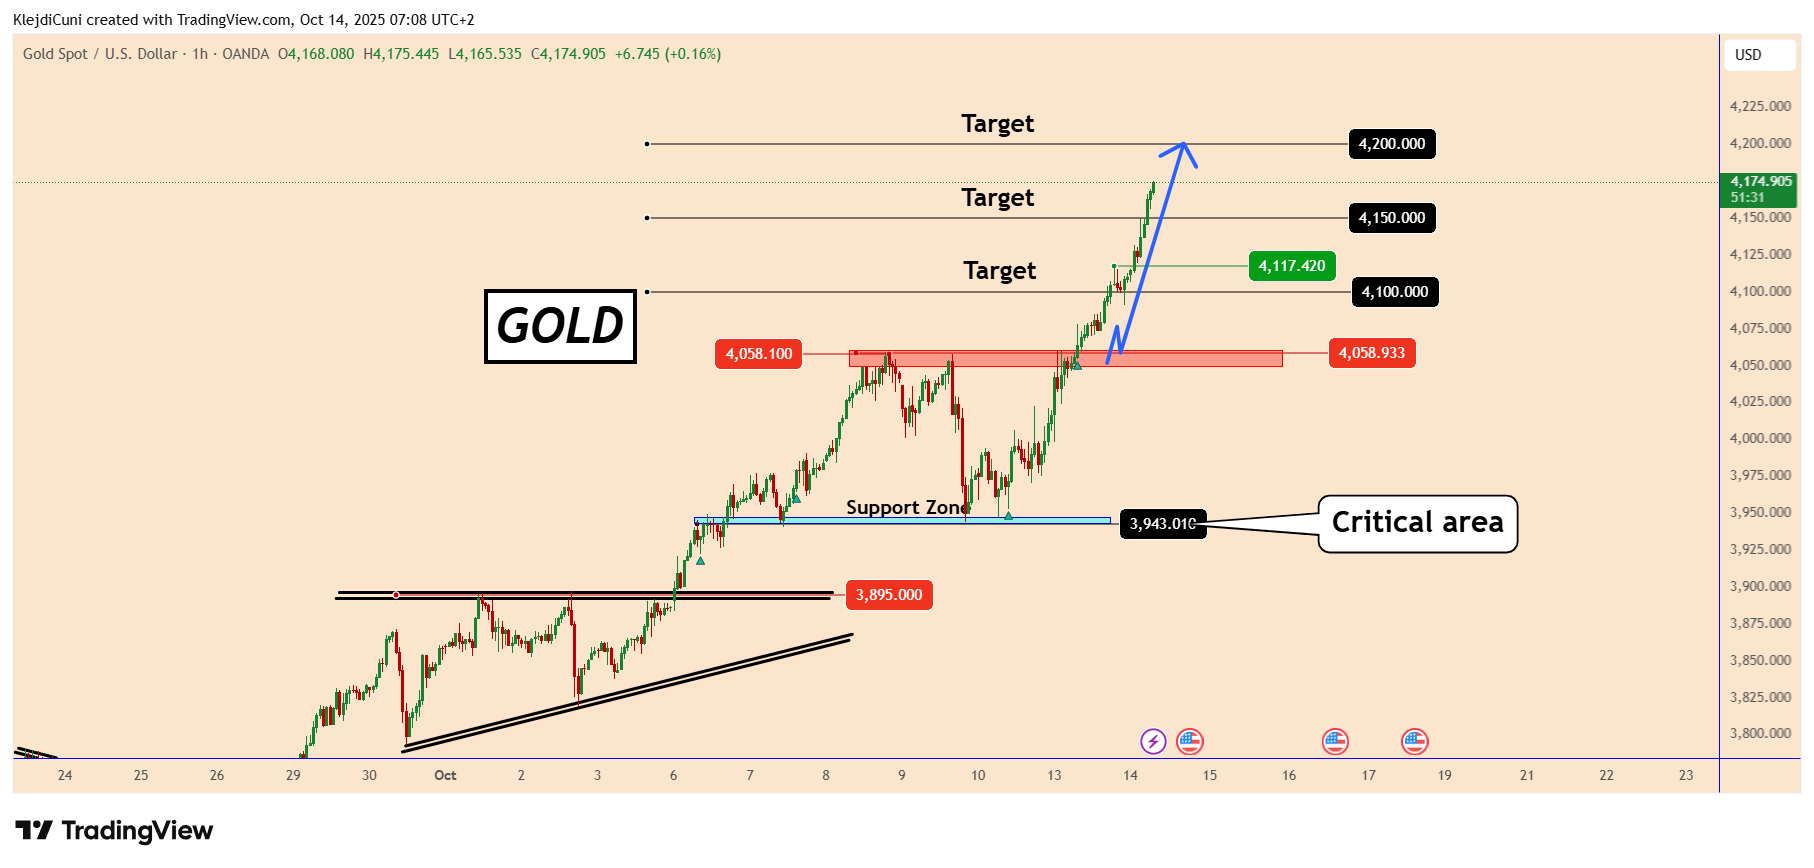

 GLOBAL TOP NEWS


 After 2 weeks that AAVE was not taking direction, Trump made that possible
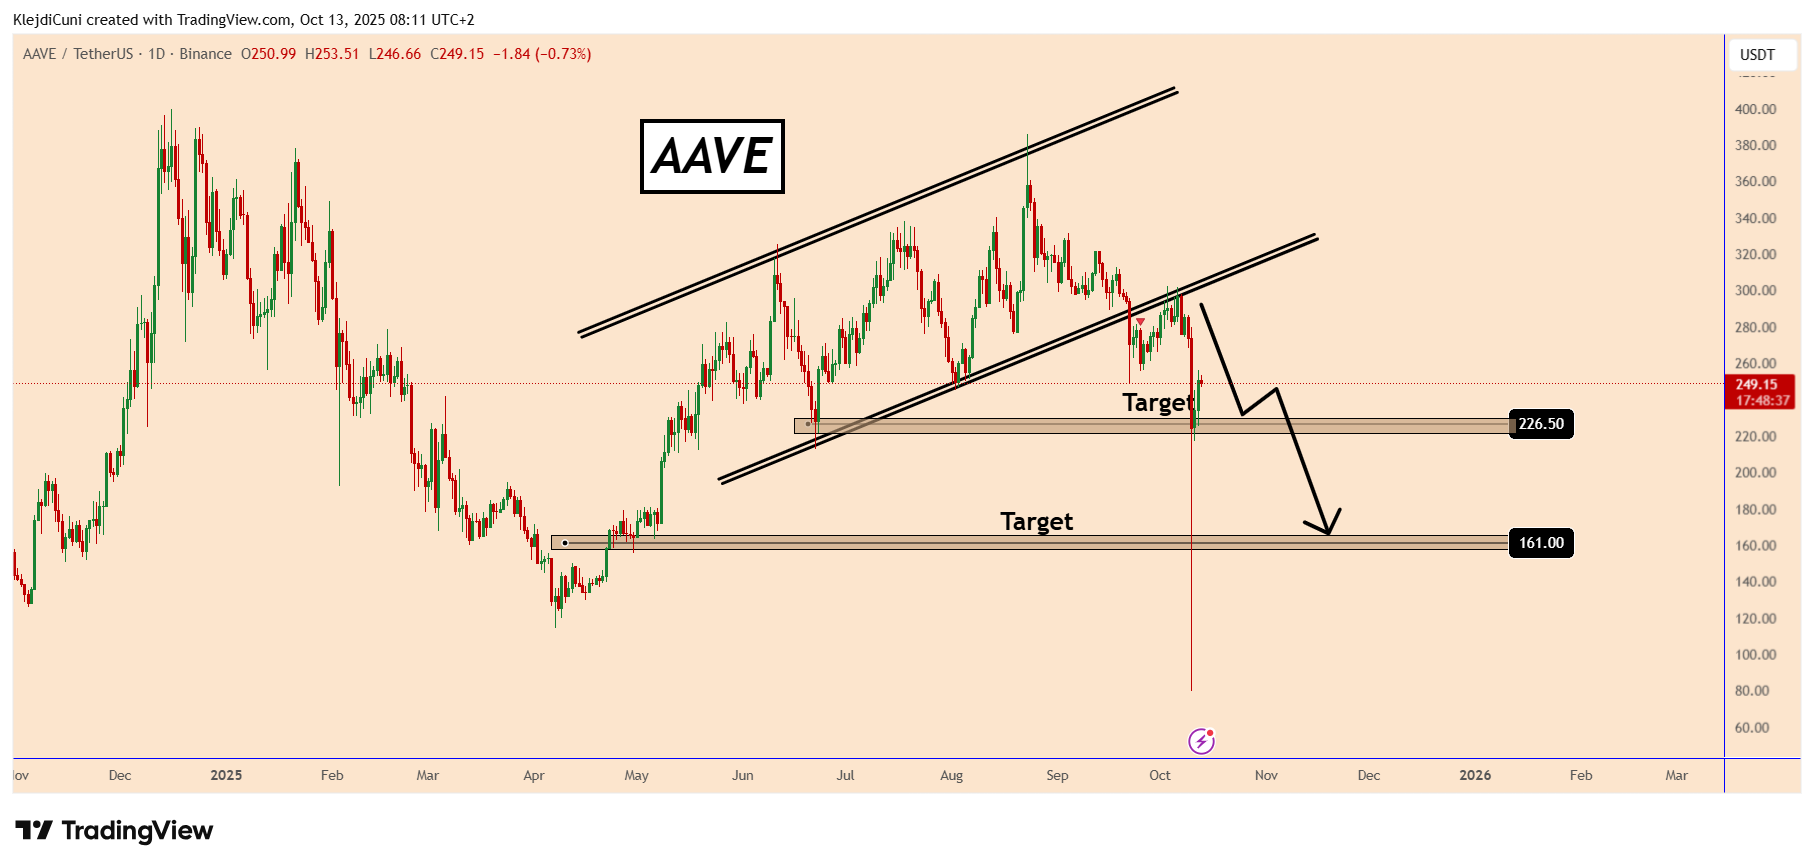
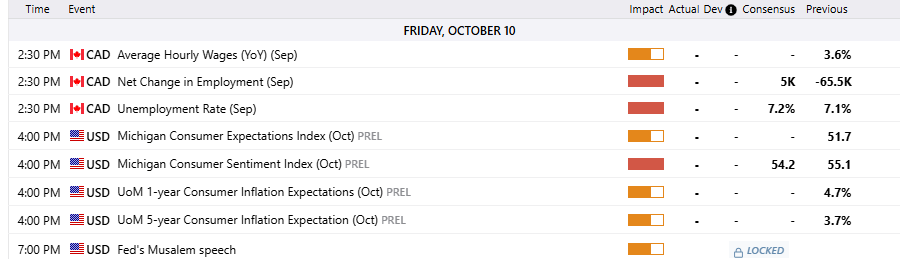
 Key Economic Data For Today 13-Oct-2025
 USD Columbus Day
 CAD Thanksgiving Day
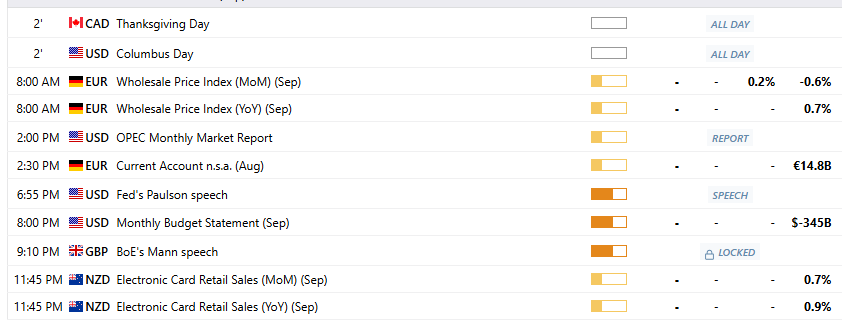

 ️ On Friday, the market experienced some very strange moves, and many of them had nothing to do with Trump’s comments. Every time he speaks, something moves in a crazy way, but for some reason, the moves are so fast that retail traders can’t trade the news in the right direction. Why?

 Bullish Scenario:
 Bearish Scenario: