Bitcoin Remains Well Positioned For a Deeper Correction
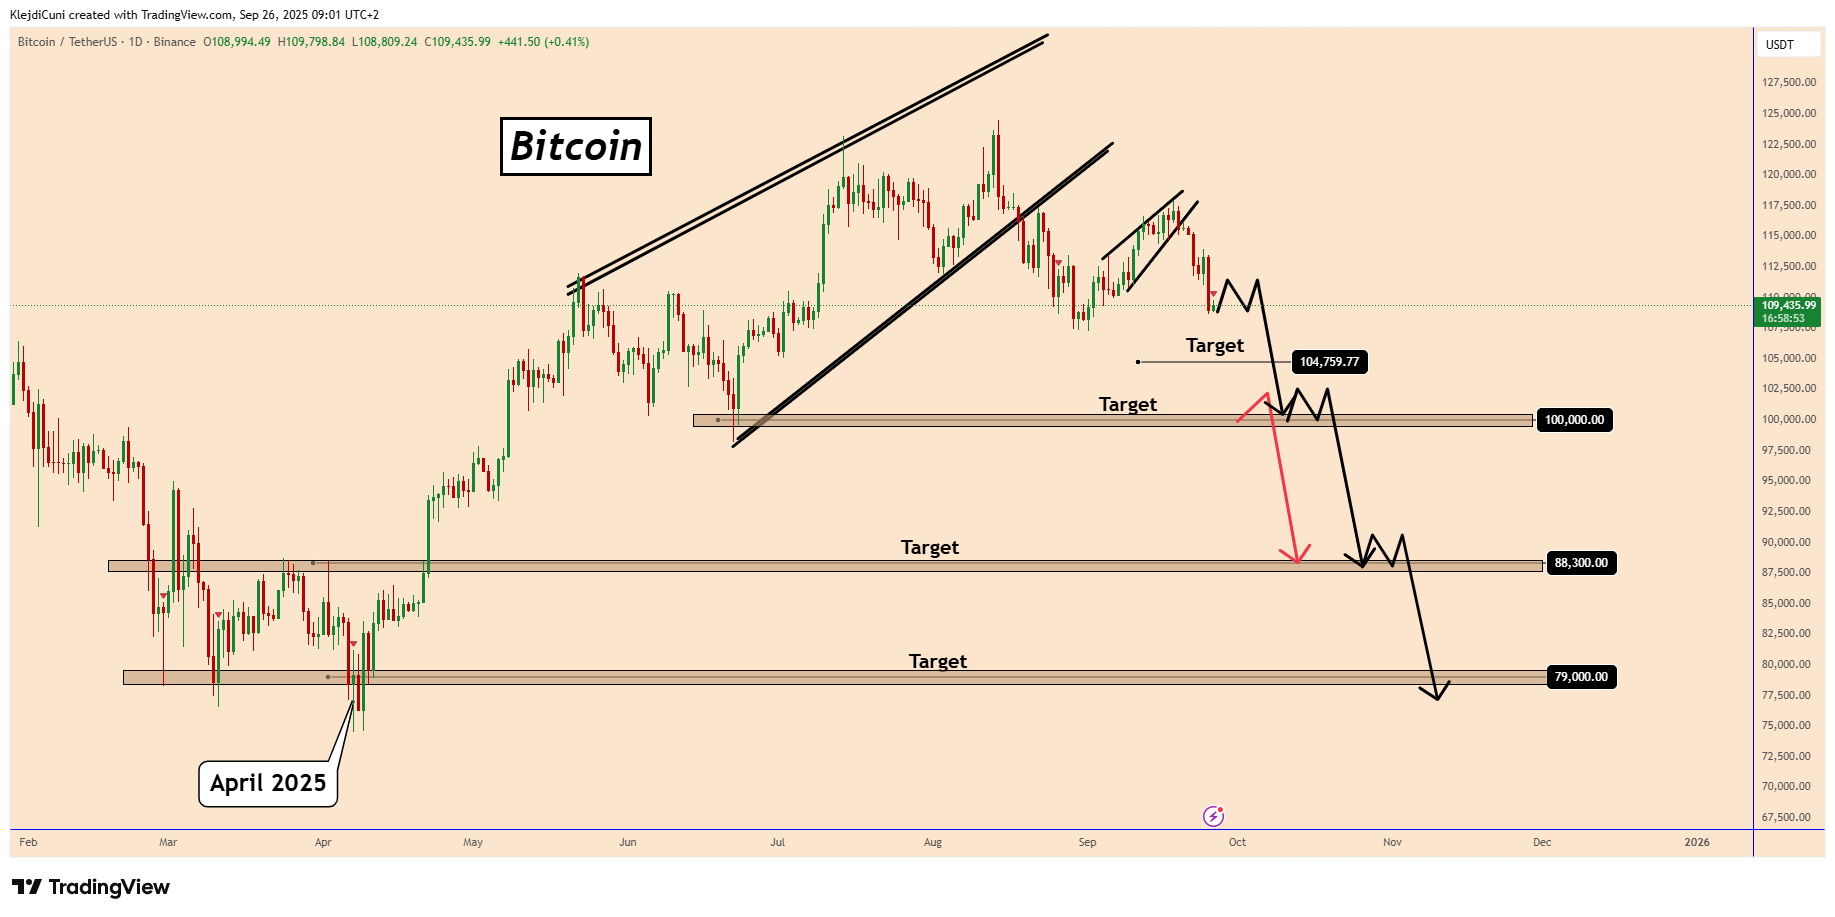
Bitcoin is currently trading around 109,300 USDT after failing to continue higher. The chart shows signs of weakness, with a potential bearish move ahead.
It looks like we could be in for a bigger correction before the price drops further. That’s what the data so far suggests.
Whether BTC will extend into a normal correction or a bigger correction remains to be seen. We can not predict when the price might finish the correction most of the time.
If the bearish scenario continues, the next key support targets are:
100,000
88,300
79,000
Bitcoin is under pressure, and unless it recovers strongly above current highs, we may see a gradual move down toward the listed targets.
You may find more details in the chart!
Thank you and Good Luck!
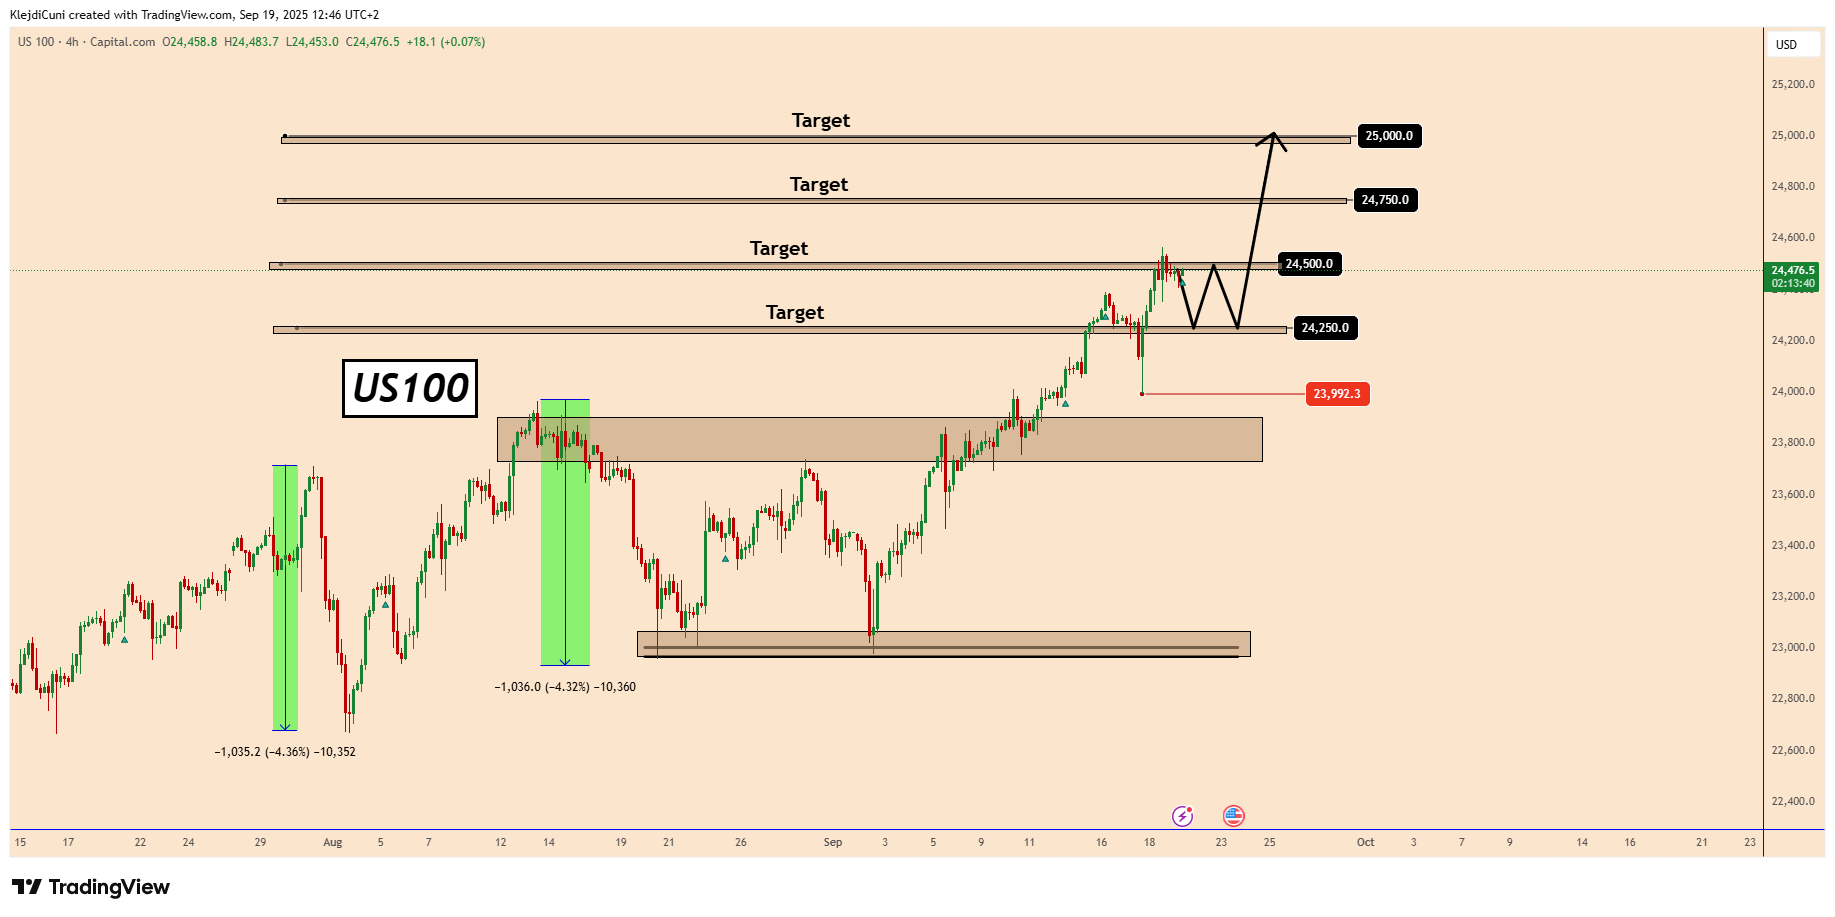
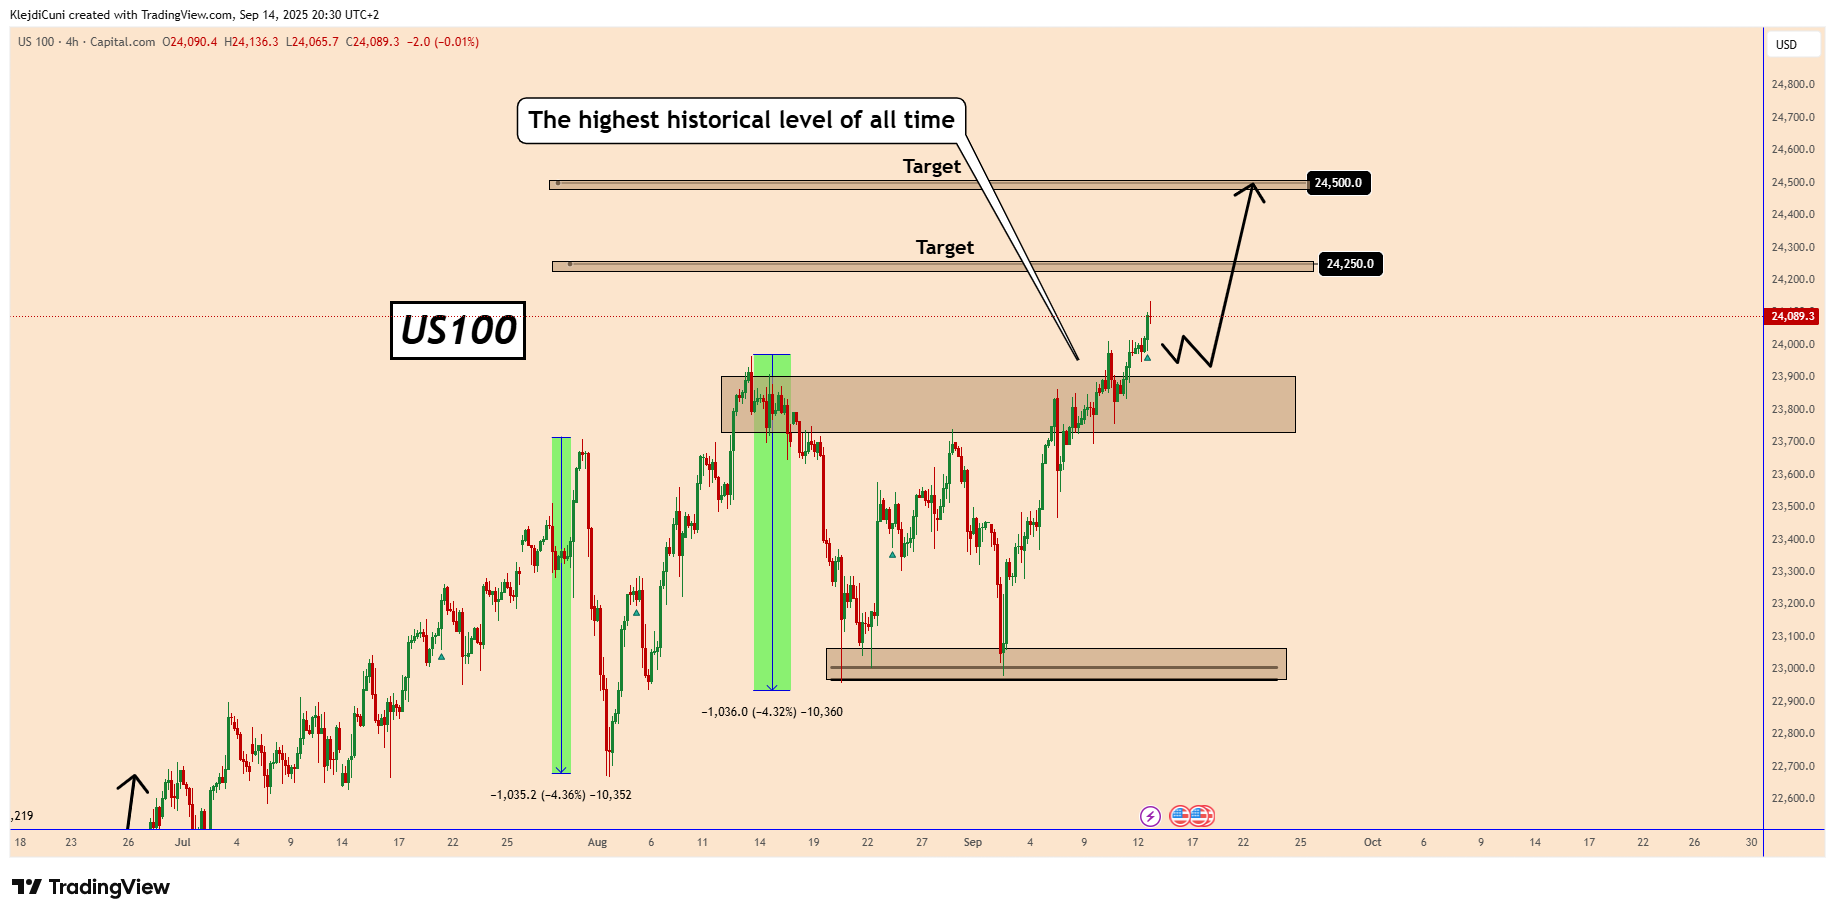 US100 Hits All-Time High
 MARKET VIEW
 GLOBAL TOP NEWS
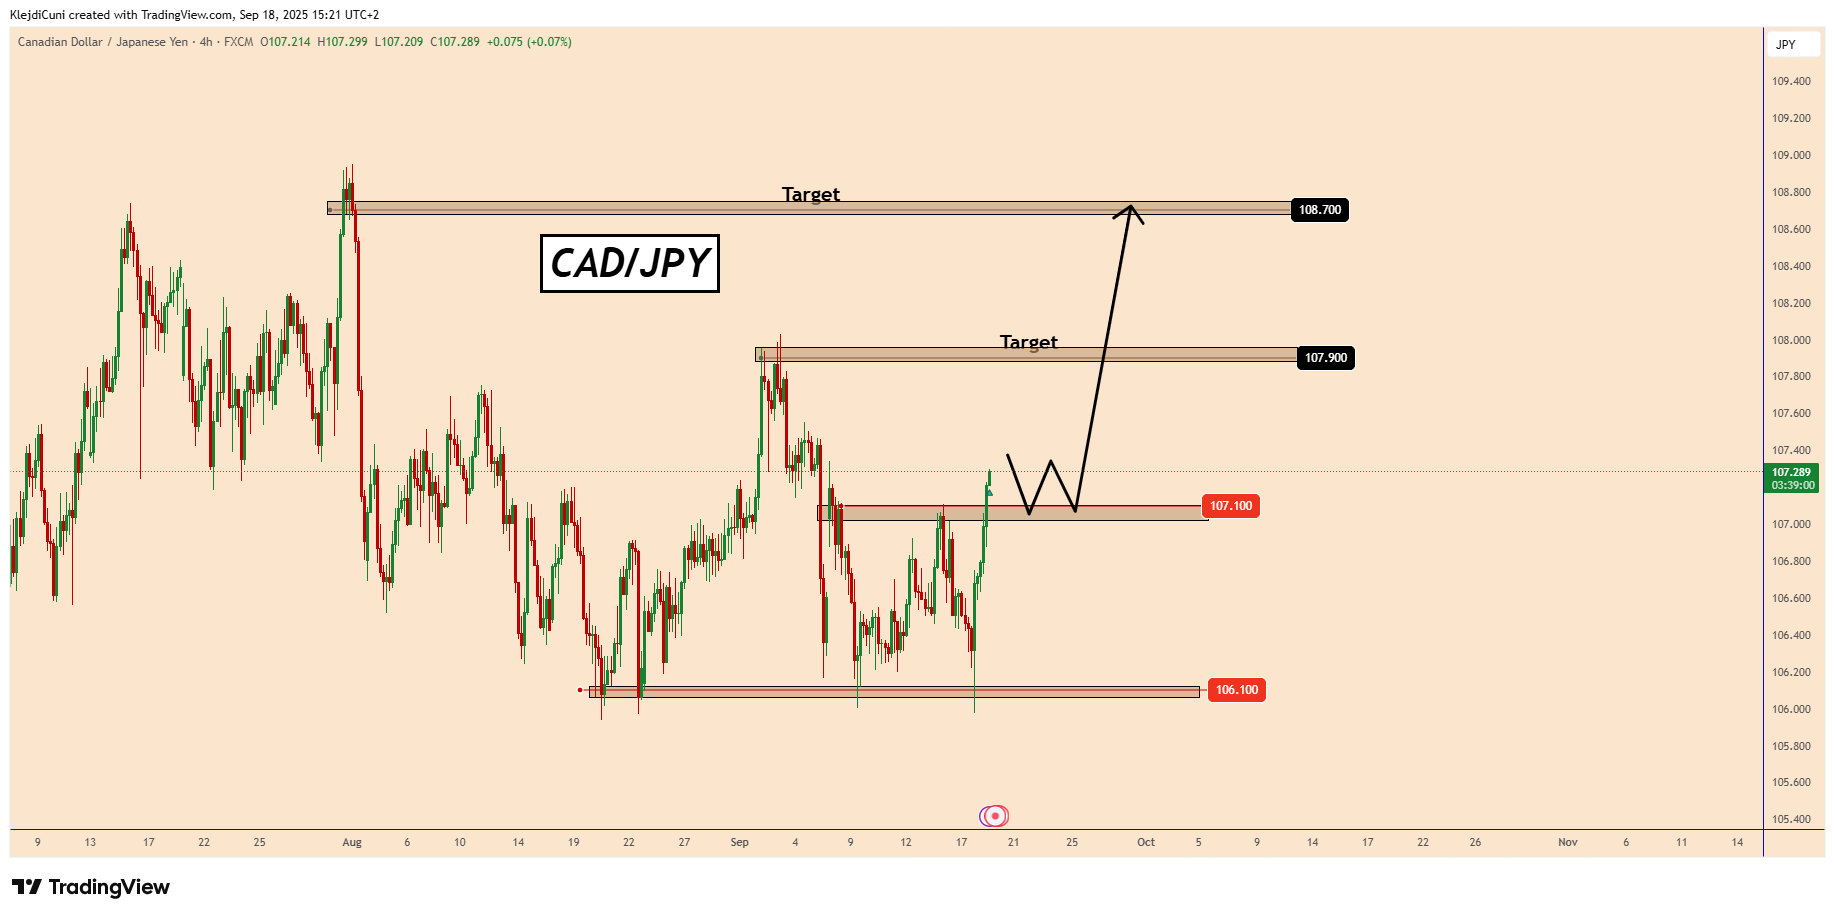
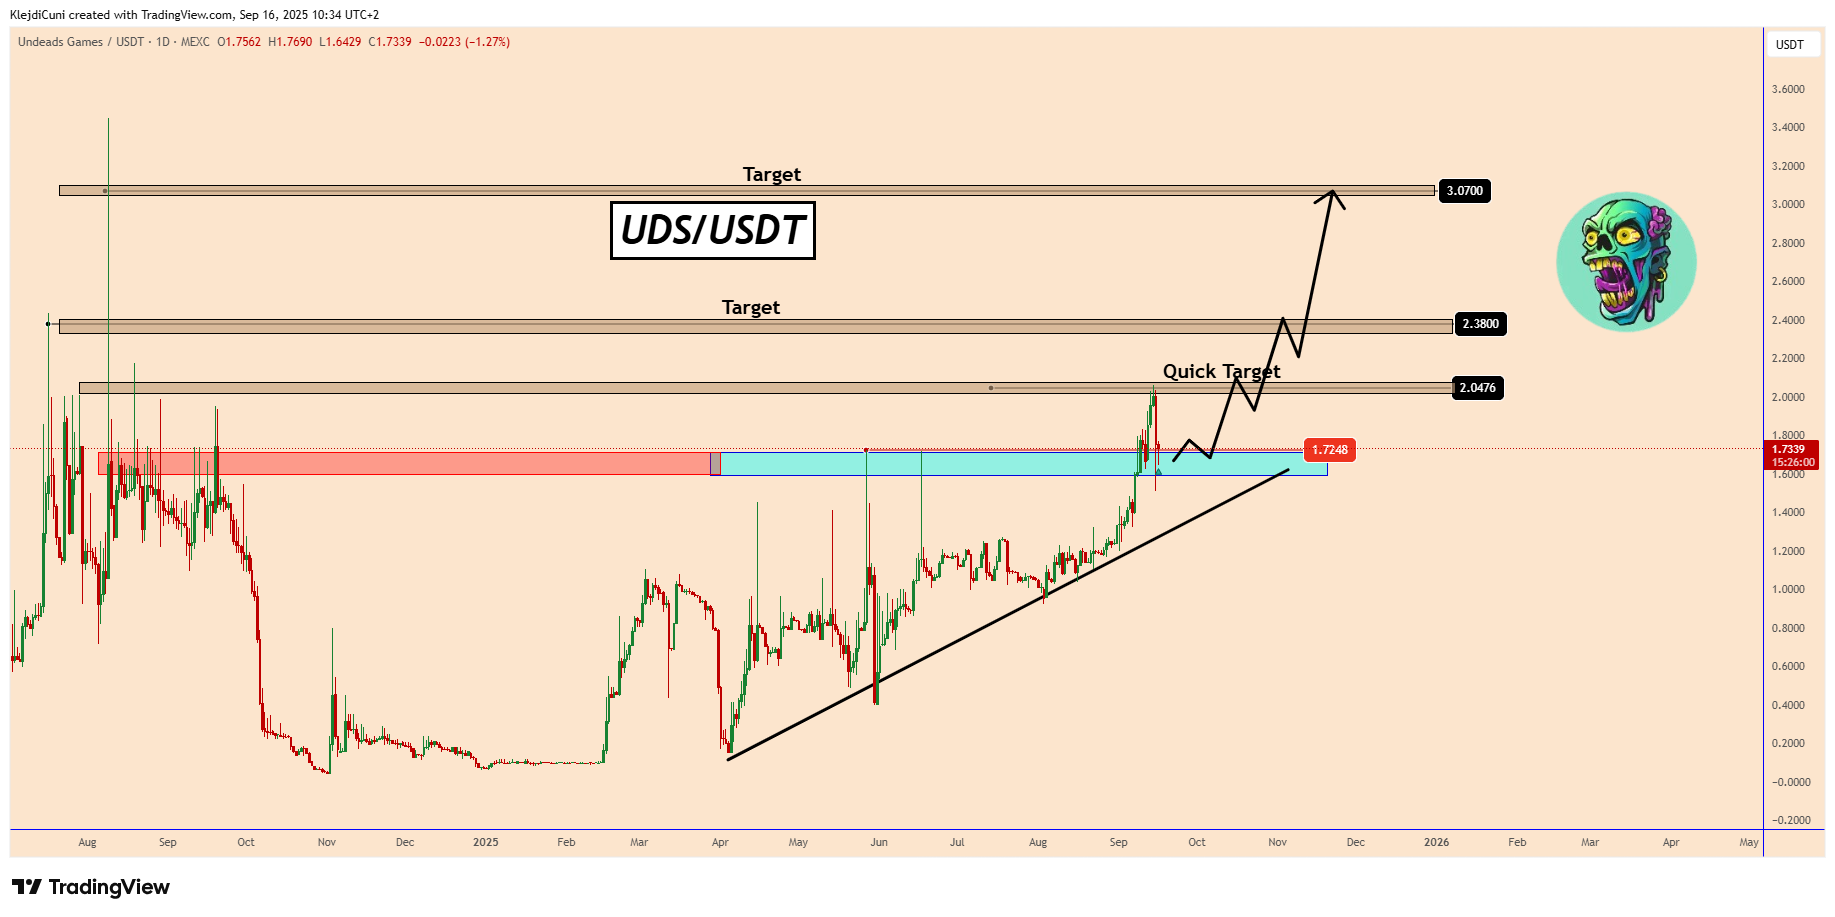
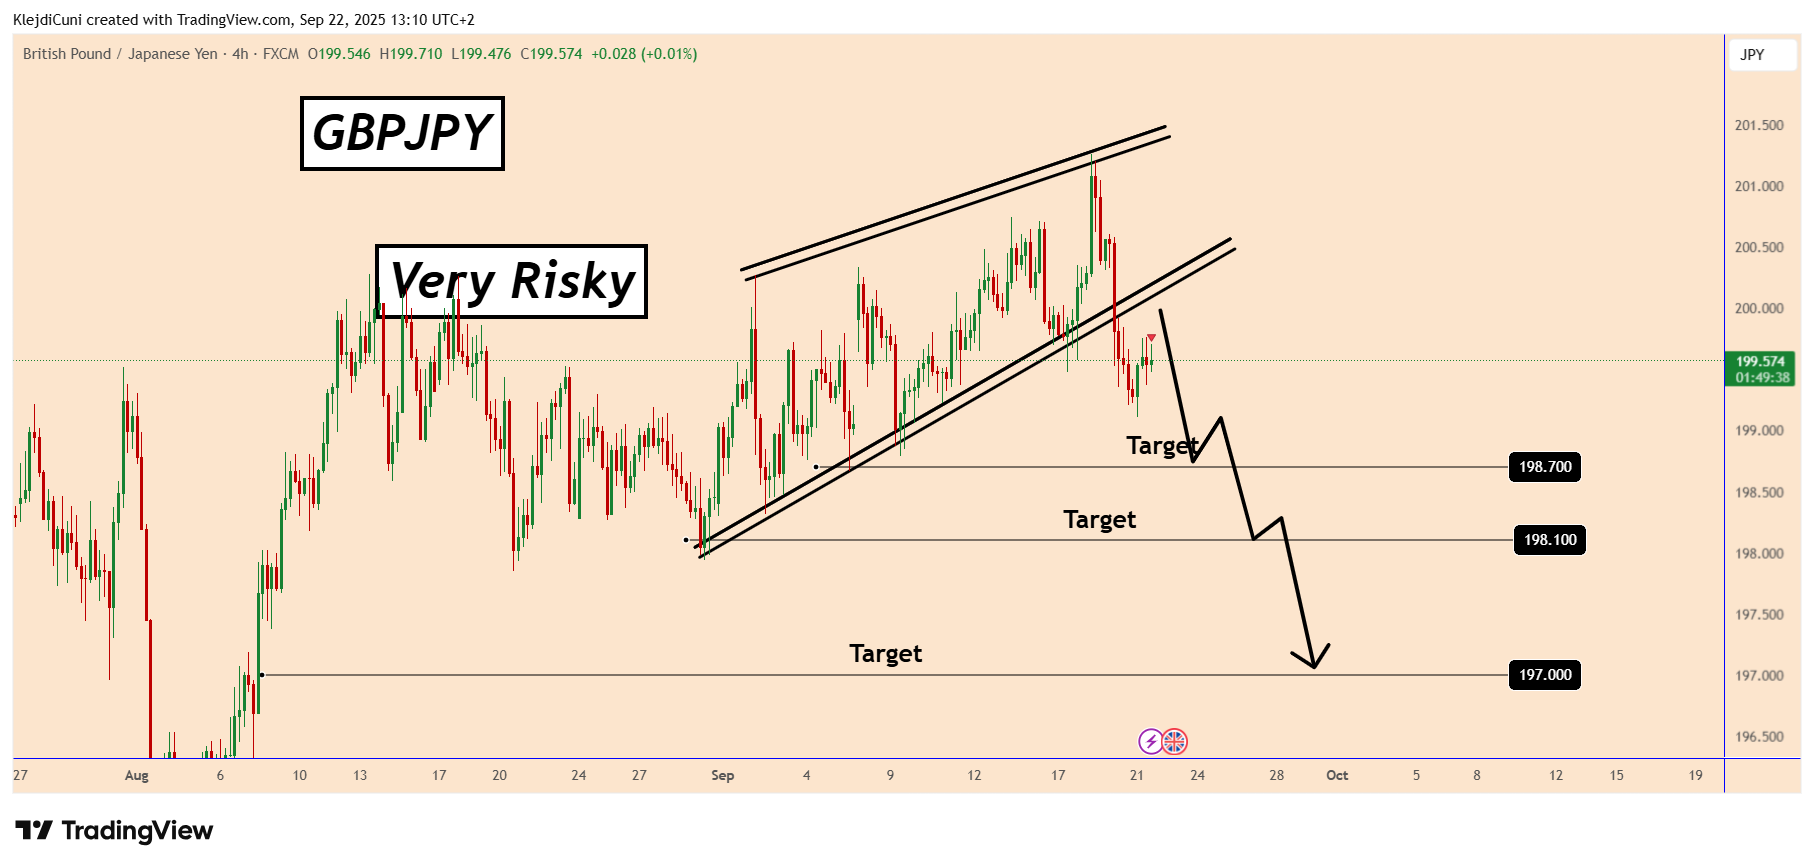
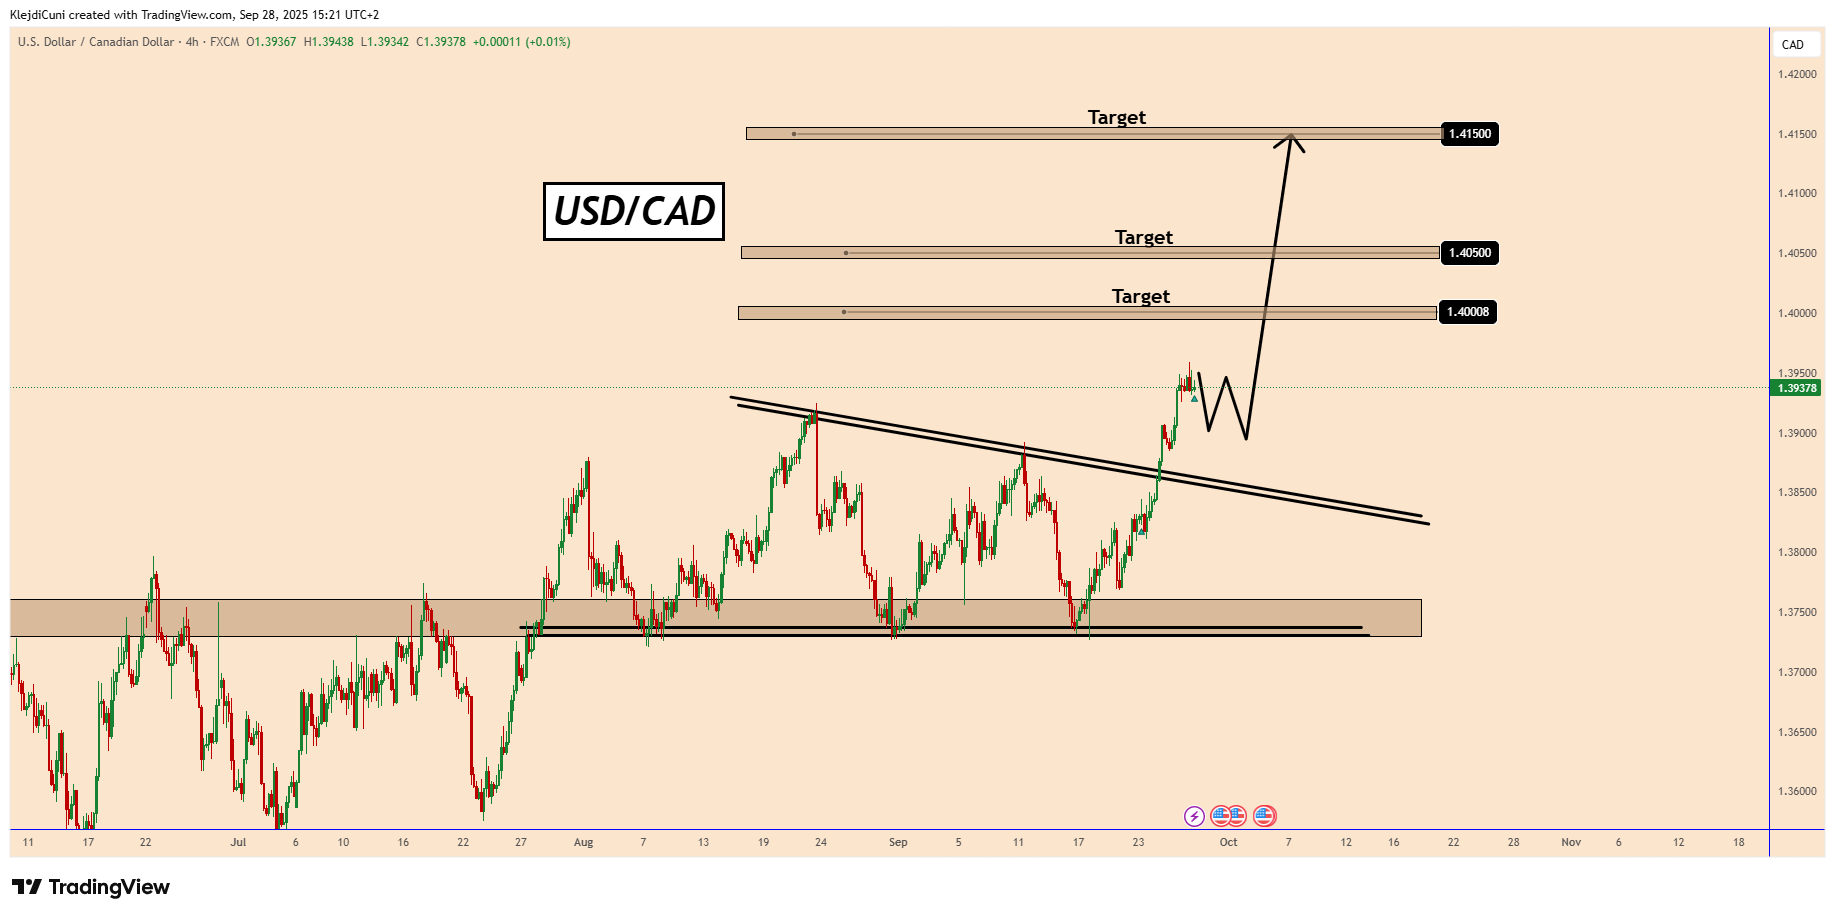
 Target Zones:

 Key Economic Data For Today
  (
( London Time)
 13:30 CAD Gross Domestic Product (MoM) (Jul)
 13:30 USD Core Personal Consumption Expenditures - Price Index (Aug)
 Standard Reaction:
 !
!
 ️The market can be tricky this time, so be careful and use proper risk management.
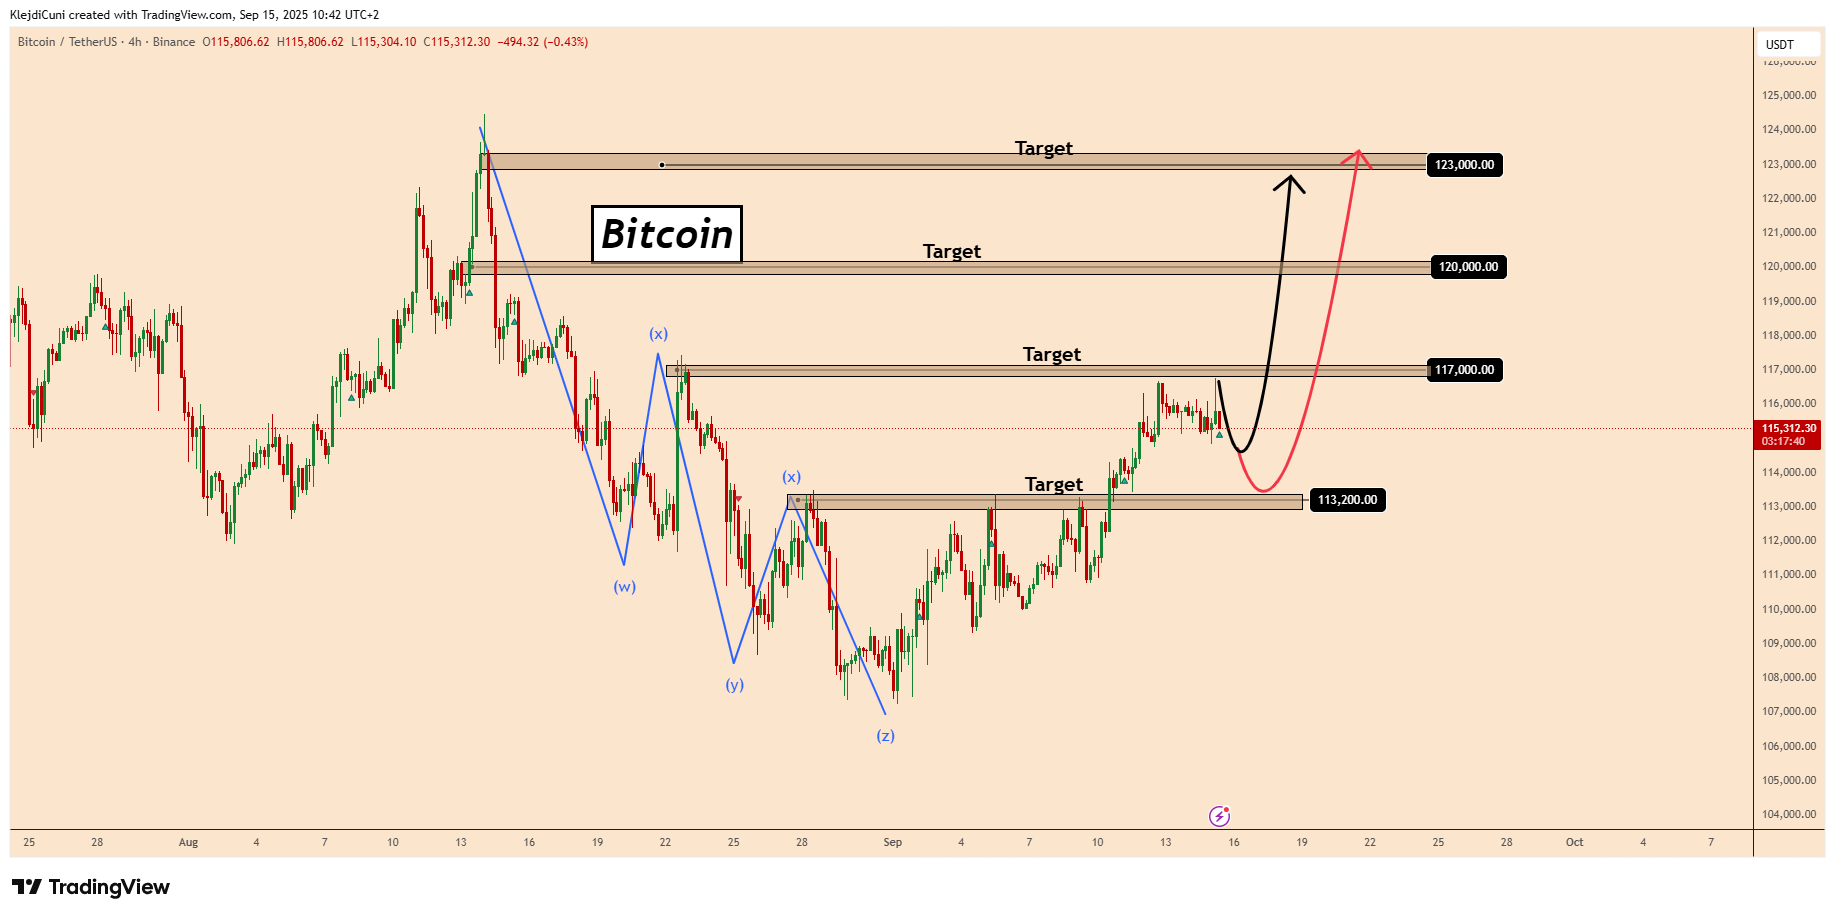 !
!
 ️PS: Please support with a like or comment if you find this analysis useful for your trading day