ed
Posts
-
Vitalik bought the dip too -
buying the dip day number 201
-
Help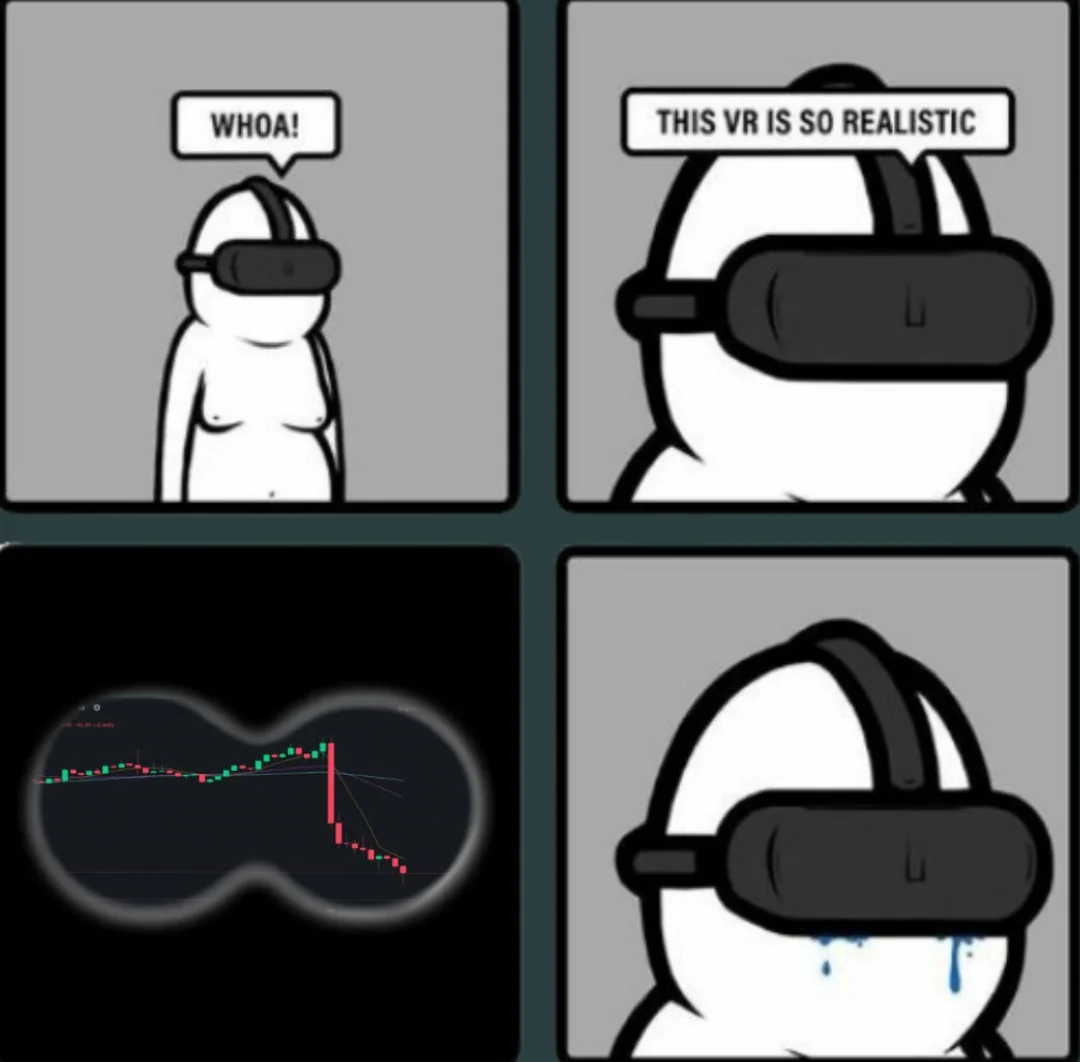
-
Europe advances on Solana liquid staking as US regulators hesitate
Europe has moved ahead on liquid staking products even as U.S. regulators remain cautious. While several Solana staking ETFs have been approved in the United States, liquid staking products such as those holding JitoSOL have not yet received clearance.
In 2024, Solana staking ETFs in the U.S. attracted strong inflows, with launches from Bitwise and Grayscale drawing hundreds of millions in assets. However, the Securities and Exchange Commission continues to bar liquid staking within ETP structures.
Jito Labs and asset managers including VanEck and Bitwise have urged regulators to reconsider, arguing liquid staking improves capital efficiency. Jito executives say they expect approval eventually, citing growing interest from U.S., Asian, and Middle Eastern markets.
-
How JitoSOL enables liquid staking for institutional investors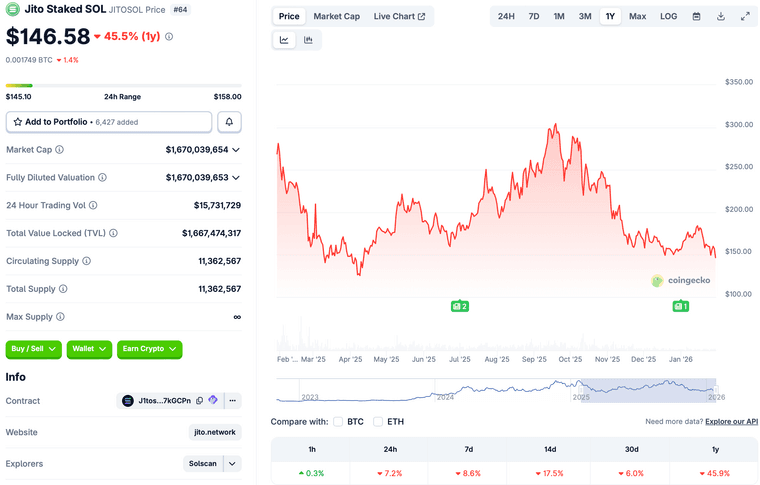
JitoSOL represents SOL deposited into a liquid staking program on the Solana network. Unlike traditional staking, where assets are locked, liquid staking allows tokens to remain transferable while still earning yield.
By holding JitoSOL, investors gain exposure to staking rewards and MEV-related returns without delegating to validators or handling technical operations. Jito said the structure is designed to meet institutional needs for liquidity, transparency, and operational simplicity.
The new European ETP builds on earlier efforts by Jito Labs and asset managers to expand institutional access to liquid staking. JitoSOL currently has a market capitalization of about $1.67 billion, highlighting growing demand for flexible staking infrastructure on Solana.
-
21Shares launches Europe’s first Jito-staked Solana ETP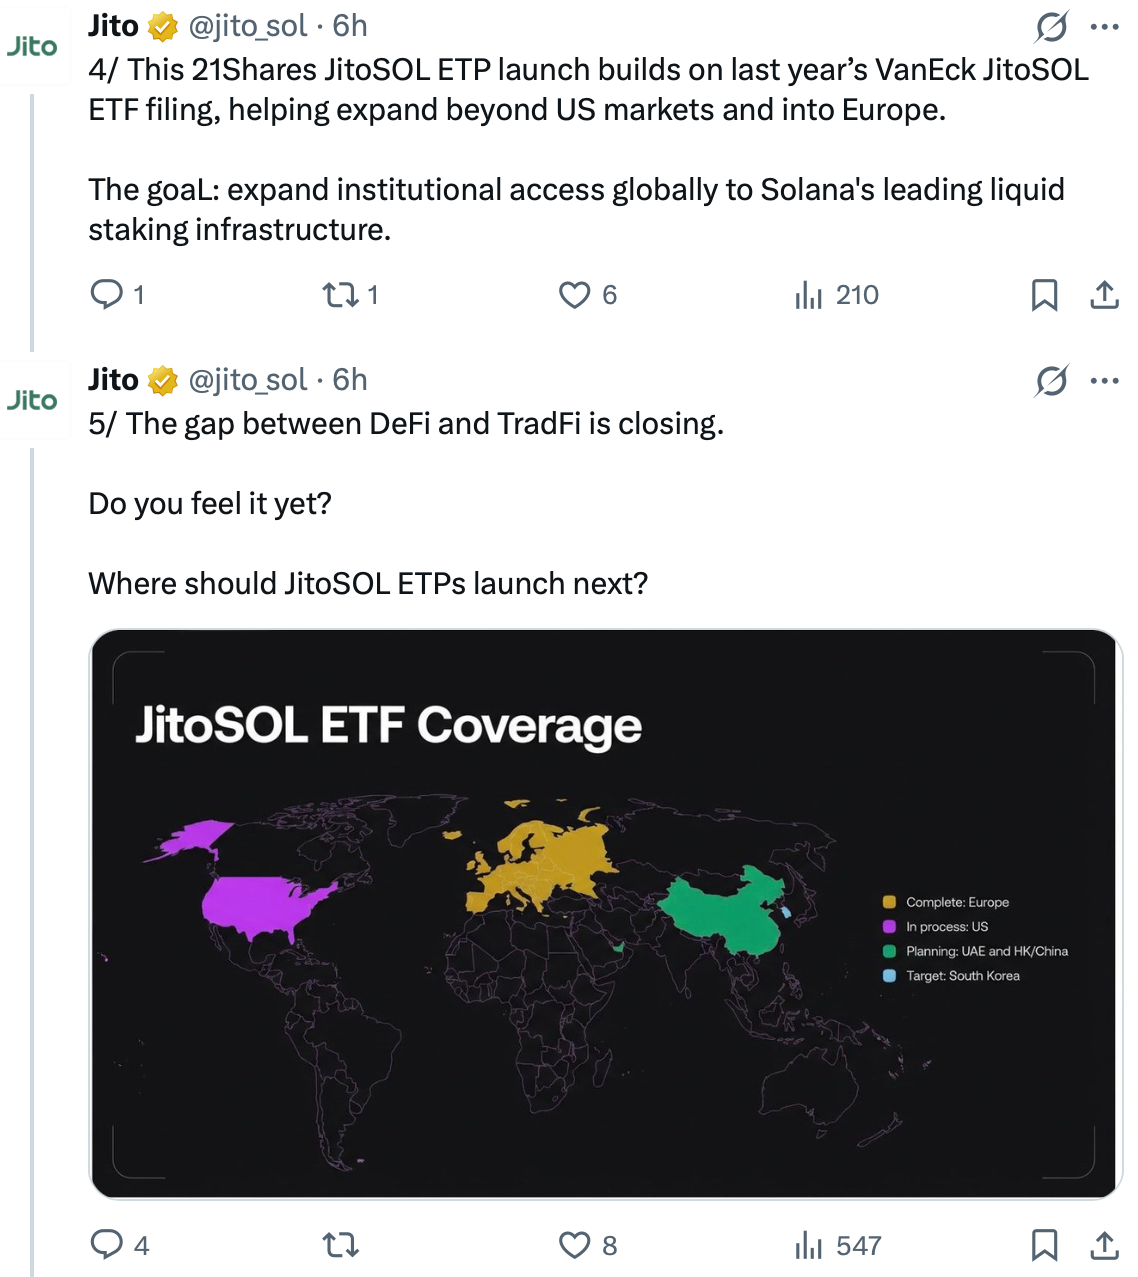
Asset manager 21Shares has launched a new Solana exchange-traded product in Europe that embeds staking directly into the structure. The 21Shares Jito Staked SOL ETP trades under the ticker JSOL and is listed on Euronext Amsterdam and Paris in both U.S. dollars and euros.The product is backed by JitoSOL, a liquid staking token issued by Jito Network, and holds the asset directly. Staking rewards are reflected in the ETP’s net asset value, giving investors exposure to Solana while earning yield without managing onchain staking.
According to 21Shares, the launch marks the first Europe-listed ETP backed by JitoSOL and expands regulated access to Solana staking products.
-
Crypto exchange volumes rose in 2025, with Binance still on top
Trading activity across major crypto exchanges increased in 2025, according to CoinGecko. Six of the top 10 exchanges by market share saw higher volumes, with average growth of 7.6%, adding roughly $1.3 trillion in additional trades.
MEXC emerged as the fastest-growing platform, posting a 91% jump in trading volume to $1.5 trillion, driven largely by its zero-fee spot trading strategy. Binance remained the industry leader, handling an estimated $7.3 trillion in volume, though its activity dipped slightly year over year.
Despite periods of market weakness, 2025 proved to be a strong year overall, as Bitcoin and other major cryptocurrencies reached multiple all-time highs.
-
How Bybit avoided the fate of most hacked crypto platforms
Most crypto platforms never fully recover from major security breaches. According to Immunefi CEO Mitchell Amador, nearly 80% of projects that suffer a hack fail to regain trust or operational stability.
Bybit took a different approach. The exchange kept withdrawals open during the February incident and honored all user transactions. CEO Ben Zhou also addressed users publicly, stating the company had sufficient reserves and would secure external liquidity if needed.
Those measures appear to have paid off. Bybit went on to post $1.5 trillion in trading volume for 2025, underscoring how transparency, continuity of service, and liquidity assurances can play a decisive role in restoring confidence after a crisis.
-
Bybit stages comeback after historic $1.5B crypto hack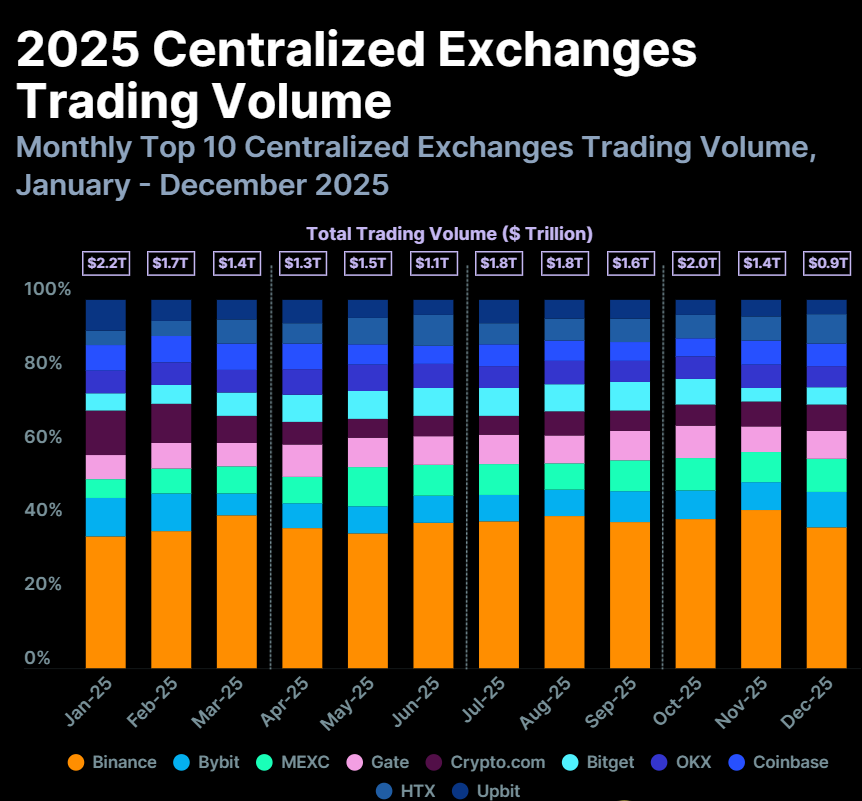
Bybit recorded the second-highest trading volume among crypto exchanges in 2025, marking what CoinGecko describes as a “slow but steady comeback” following a $1.5 billion hack earlier in the year.
The exchange processed roughly $1.5 trillion in trading volume across 2025, capturing 8.1% of the global market, according to CoinGecko analyst Shaun Paul Lee. The recovery is notable given that the February breach — the largest crypto hack on record — involved North Korean attackers exploiting a vulnerability in Bybit’s cold wallet infrastructure.
Despite the scale of the attack, CoinGecko said Bybit gradually regained user activity throughout the year, returning to the upper tier of global exchanges.
-
Big Tech’s AI dilemma: massive investment, unclear returns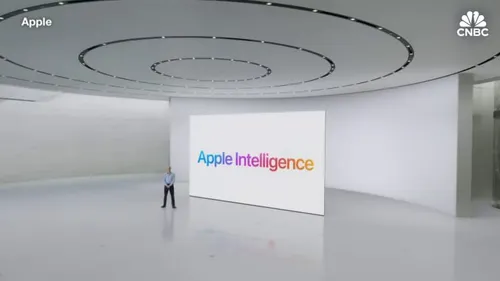
Tim Cook’s response to questions about AI monetization offered few specifics. He emphasized that Apple is embedding intelligence across its operating systems in a “personal and private” way, arguing that this creates long-term value and future opportunities across products and services.
That answer reflects a wider trend in the tech industry. Despite heavy spending, many companies have yet to clearly articulate how AI will translate into profits. OpenAI, for example, has indicated it does not expect to be cash-flow positive until at least 2030, with analysts questioning whether that timeline is realistic given capital requirements.
As AI costs continue to rise, investors may increasingly demand clearer answers. For now, the industry appears confident that value creation will eventually lead to monetization — even if the mechanics remain undefined.
-
Apple beats earnings expectations — but faces a familiar AI question
Apple surpassed Wall Street expectations in its latest quarterly earnings, reporting $143.8 billion in revenue, a 16% increase year over year. While most analyst questions during the earnings call focused on performance and margins, one question stood out.
Morgan Stanley analyst Erik Woodring pressed CEO Tim Cook on a topic increasingly difficult for Big Tech to avoid: monetization of artificial intelligence. As competitors race to integrate AI features into consumer devices, Woodring asked how Apple plans to generate incremental revenue from its growing AI investments.
The question highlighted a broader investor concern. AI integration is expensive, and while adoption is rising, the path from innovation to sustained profitability remains unclear — even for companies with Apple’s scale and balance sheet.
-
Why a SpaceX merger could reshape Musk’s business empire
A merger involving SpaceX could bring together rockets, satellites, AI systems, social media, and energy infrastructure under a single corporate umbrella. One reported scenario would unite SpaceX and xAI, combining Starlink satellites, launch services, the X platform, and the Grok chatbot into one company.
Such a move aligns with Musk’s push to consolidate resources. SpaceX and Tesla have each invested $2 billion in xAI, and xAI acquired X last year in a deal valuing the AI firm at $80 billion. SpaceX itself was recently valued at around $800 billion in a secondary sale.
A SpaceX–Tesla merger could also tie Tesla’s energy storage business to Musk’s vision of space-based data centers. While timelines remain uncertain, recent actions suggest Musk is laying groundwork for deeper integration across his companies.
-
Elon Musk explores potential merger between SpaceX, Tesla, and xAI
Three of Elon Musk’s companies — SpaceX, Tesla, and artificial intelligence startup xAI — are reportedly being considered for a potential merger, according to Bloomberg and Reuters. While discussions remain at an early stage, at least one scenario could result in another Musk-led company folding into SpaceX.
Two options are under consideration. One would merge SpaceX with Tesla. Another would combine SpaceX with xAI, which already owns Musk’s social media platform, X. Reuters reports that a SpaceX–xAI merger could occur ahead of a possible SpaceX initial public offering later this year.
Neither SpaceX nor xAI has publicly commented. However, recent Nevada filings show the creation of two new entities — K2 Merger Sub Inc. and K2 Merger Sub 2 LLC — suggesting preparations for multiple structural outcomes.
-
Bitcoin’s smaller size could amplify upside versus gold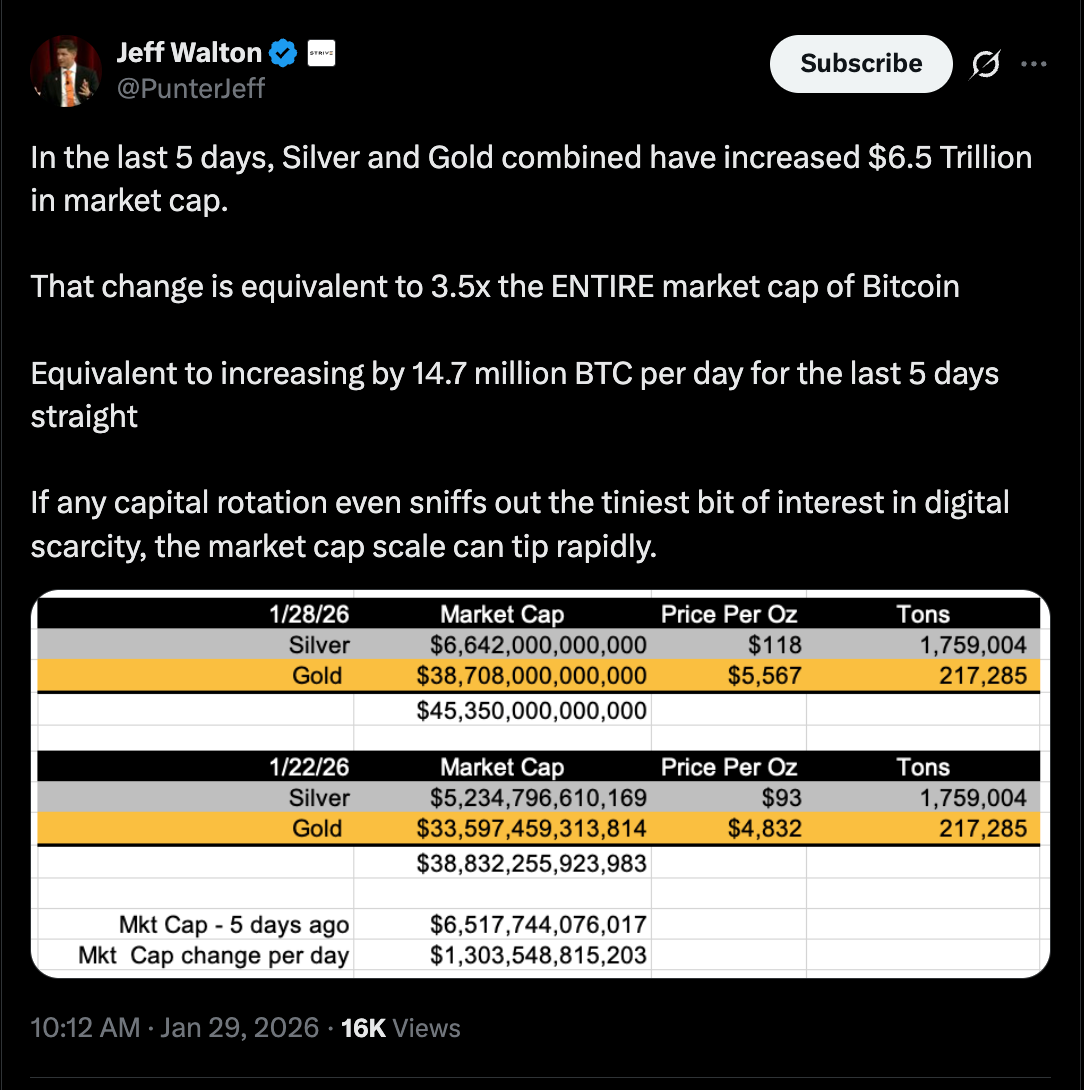
Gold still dominates the hard-asset landscape, with a market capitalization of roughly $41.7 trillion. Bitcoin, by comparison, represents just over 4% of that total.
That size gap cuts both ways. While Bitcoin remains more volatile, even small reallocations from gold-style demand could have an outsized impact on BTC’s price. Investors already using gold for inflation protection, currency hedging or geopolitical risk may view Bitcoin as a complementary allocation.
Analysts suggest that a hypothetical 5% rotation from gold into Bitcoin would translate into more than $2 trillion in inflows. At current valuations, that could imply a Bitcoin price approaching $190,000 — highlighting how marginal demand shifts may carry disproportionate effects.
-
Why Bitcoin’s inflation model contrasts sharply with gold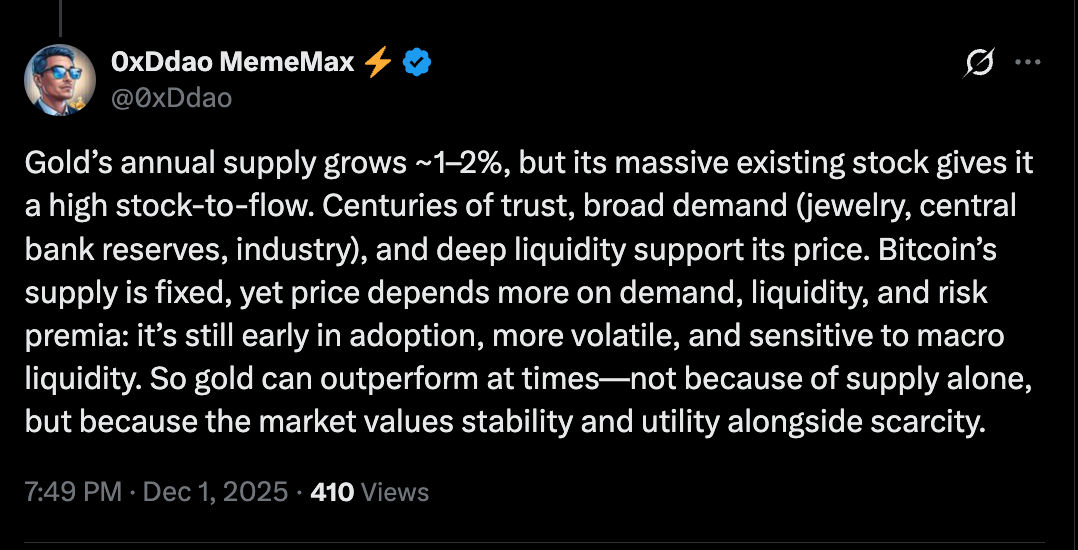
Bitcoin’s supply does not respond to demand. No matter how high prices rise, the network issues new BTC at a fixed and declining rate, heading toward a hard cap of 21 million coins.
Gold, by contrast, has no such constraint. Higher prices attract more capital into mining, accelerating production and expanding supply. Global gold output has risen steadily for decades, reaching a record 3,672 tonnes in 2025, according to the World Gold Council.
Bitcoin’s annual inflation rate stood near 0.8% at the end of 2025 and is expected to fall further after the next halving in 2028. Advocates argue this makes Bitcoin structurally more resistant to supply dilution — a feature increasingly relevant for long-term treasury and hedge strategies.
-
Bitcoin has lagged gold — but the supply story tells a different tale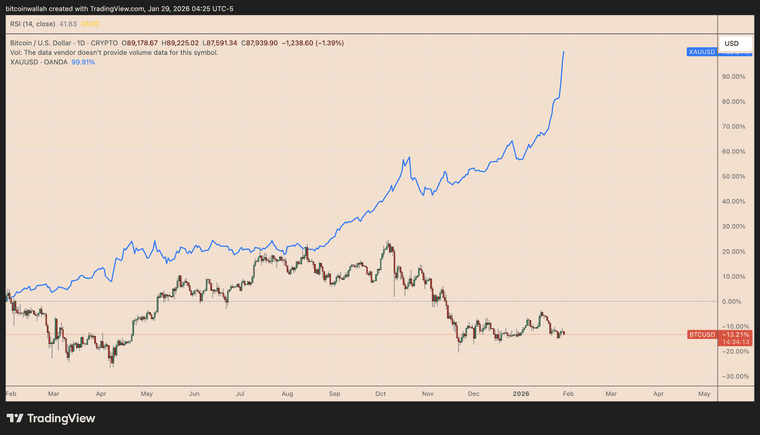
Over the past year, Bitcoin has significantly underperformed gold. BTC is down about 13%, while gold has surged nearly 100%, reigniting debate over whether Bitcoin can still compete as a hard-asset hedge.One key difference lies in supply dynamics. Bitcoin’s issuance is fixed by code, capped at 21 million coins, with roughly 93% already mined. New supply enters the market on a predictable schedule that slows over time through halvings.
Gold operates differently. Rising prices incentivize more mining, increasing above-ground supply. While Bitcoin miners can scale operations, they cannot alter issuance. Supporters argue this structural scarcity could matter more over the long term — even if short-term price performance tells a different story.
-
The race to build infrastructure worthy of global finance
The opportunity behind tokenized assets is massive, but the clock is ticking. Traditional finance is paying close attention — not just to blockchain’s promise, but to its failures. Every congested network and front-run trade reinforces skepticism.
Unlocking a true 24/7 global exchange will require more than incremental fixes. It demands infrastructure engineered for performance from day one: systems capable of handling over 100,000 transactions per second with sub-second finality.
Fairness must also be built into protocol design, eliminating malicious MEV and ensuring predictable execution. Just as critical is seamless composability, allowing assets and liquidity to move across ecosystems without friction.
The vision isn’t flawed. The foundation is. The question now is whether blockchain will build infrastructure worthy of global finance — or leave that job to traditional markets instead.
-
Why today’s blockchains can’t support institutional trading
As tokenized assets multiply, blockchain infrastructure is becoming the weakest link. Current layer-1 networks face three structural failures that make institutional-grade trading nearly impossible.
First is throughput. Many blockchains struggle under modest demand, with single popular launches congesting networks for hours. That’s incompatible with markets processing millions of trades daily.
Second is latency. Slow block times and uncertain finality undermine price discovery, turning arbitrage and high-frequency trading into risky bets rather than efficient strategies.
Most damaging is market fairness. Maximal extractable value (MEV) enables front-running and transaction manipulation, creating an uneven playing field that institutional investors simply won’t tolerate. For serious capital, execution integrity isn’t optional — it’s foundational.
-
The promise and problem of a borderless financial market
A single, global financial market operating 24/7 has long been the dream of blockchain advocates. In this vision, a farmer in Nebraska hedges wheat futures while a pension fund in Tokyo trades U.S. equities — instantly, without intermediaries or geographic barriers.
Thanks to asset tokenization, that future feels closer than ever. Stocks, bonds, commodities and real estate are already being digitized at an accelerating pace, drawing interest from both Wall Street giants and Silicon Valley startups.
But despite the momentum, the reality is stark: today’s blockchain infrastructure isn’t built to support markets at global scale. The ideas are there. The assets are there. What’s missing is the foundation capable of handling real-world financial volume, speed and fairness.
-
HEN Technologies Reinvents Firefighting With Smarter Nozzlesfounded in 2020 and already expanding into valves and smart sensors, these guys are moving fast


