


Spotting Hidden Bullish Divergences for Profit
Airdrop and Ways to earn money
3
Posts
3
Posters
5
Views
-
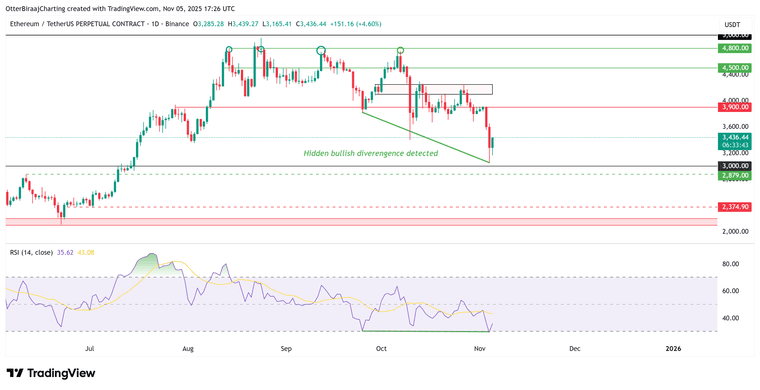
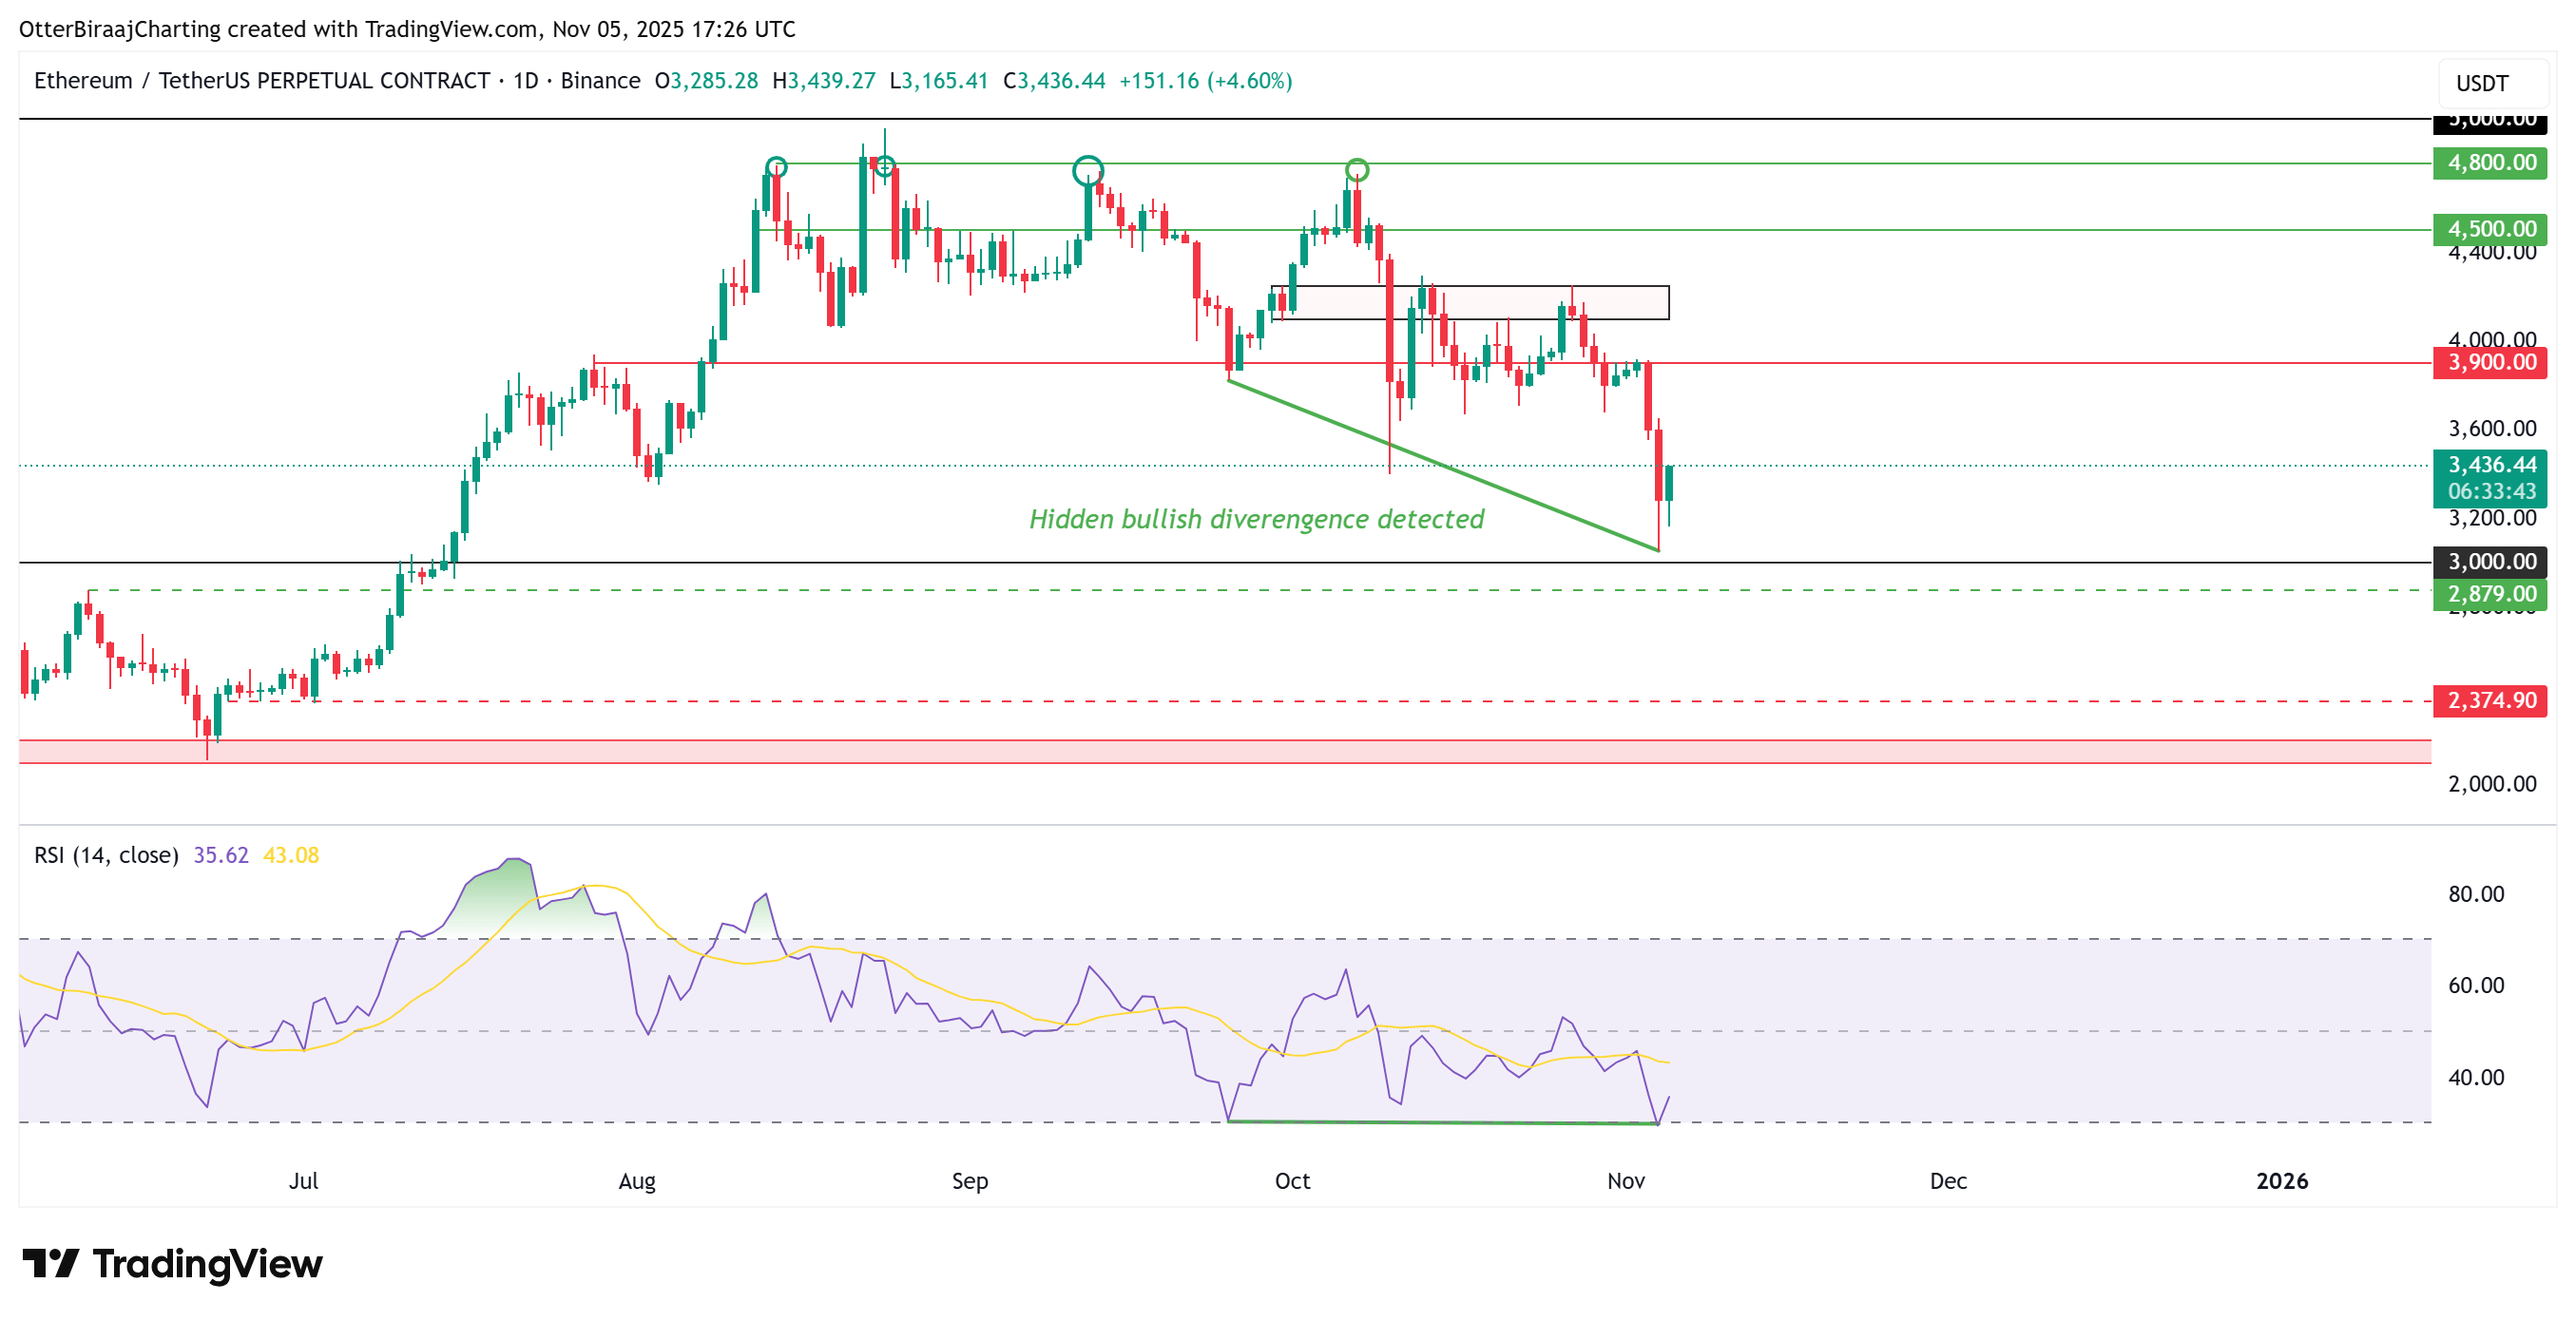
ETH’s daily chart shows a hidden bullish divergence — price making lower lows, while the RSI holds steady.
This pattern often signals a reversal and early signs of strength before the broader market catches on.Combine that with ETH testing long-term AVWAP support zones, and the setup suggests the correction may be nearing exhaustion.
 Pro tip: When RSI holds steady while price drops, it often means sellers are running out of steam — a smart entry point for patient traders.
 -
The best traders see momentum before it shows on the chart.
 ️
️