


The XRP Bull Case Is Compelling — But Here Is Exactly Where It Falls Apart
-
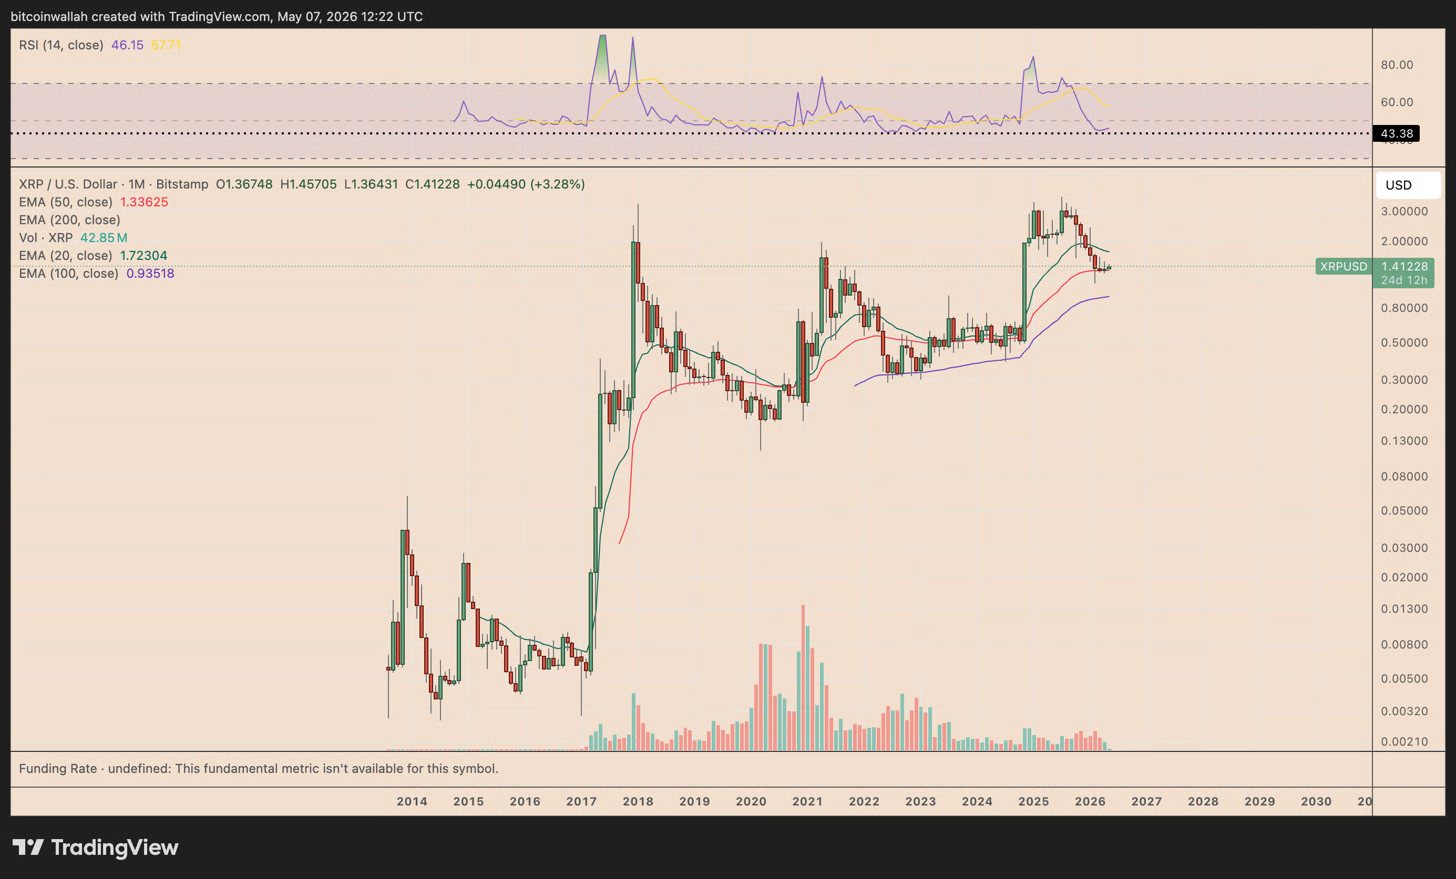
XRP/USD monthly chart. Source: TradingViewXRP's technical setup has attracted significant bullish commentary in recent days, with analysts pointing to long-term channel support, cooling RSI readings, and record ETF inflows as evidence that the token is bottoming out ahead of a major move higher. The bull case is real and worth taking seriously — but so is the risk scenario, and understanding precisely where the thesis breaks down is just as important as understanding why it might succeed. The current support zone in the $1.30–$1.40 range overlaps with two critical technical levels simultaneously: the lower trendline of the rising channel that has defined XRP's price action since 2014, and the 50-month exponential moving average sitting near $1.33. That confluence makes the zone genuinely significant — but it also means that a sustained daily close below it would be a serious technical deterioration, not just a minor pullback.
If XRP loses that support cluster, the next meaningful level of technical support is the 100-month EMA near $0.93 — implying a drop of approximately 30% from current prices. That kind of move would not be without precedent: a nearly identical plunge from the equivalent support zone occurred during the 2022 bear market, which was one of XRP's most painful extended drawdowns. The bear scenario does not require anything catastrophic — just a failure to hold the channel and EMA support under sustained selling pressure, which becomes more likely if broader crypto market sentiment deteriorates or the ETF inflow momentum reverses. For investors considering entering or adding to an XRP position at current levels, the risk-reward is genuinely asymmetric in both directions: the bull case projects a move toward $8–$14, while the bear case points to $0.93. Sizing positions accordingly — rather than treating the bull case as a certainty — is the most rational approach to a setup this technically loaded.
