


XRP Is Testing a 10-Year Support Level — And Analysts Say It Could Launch Toward $12
-
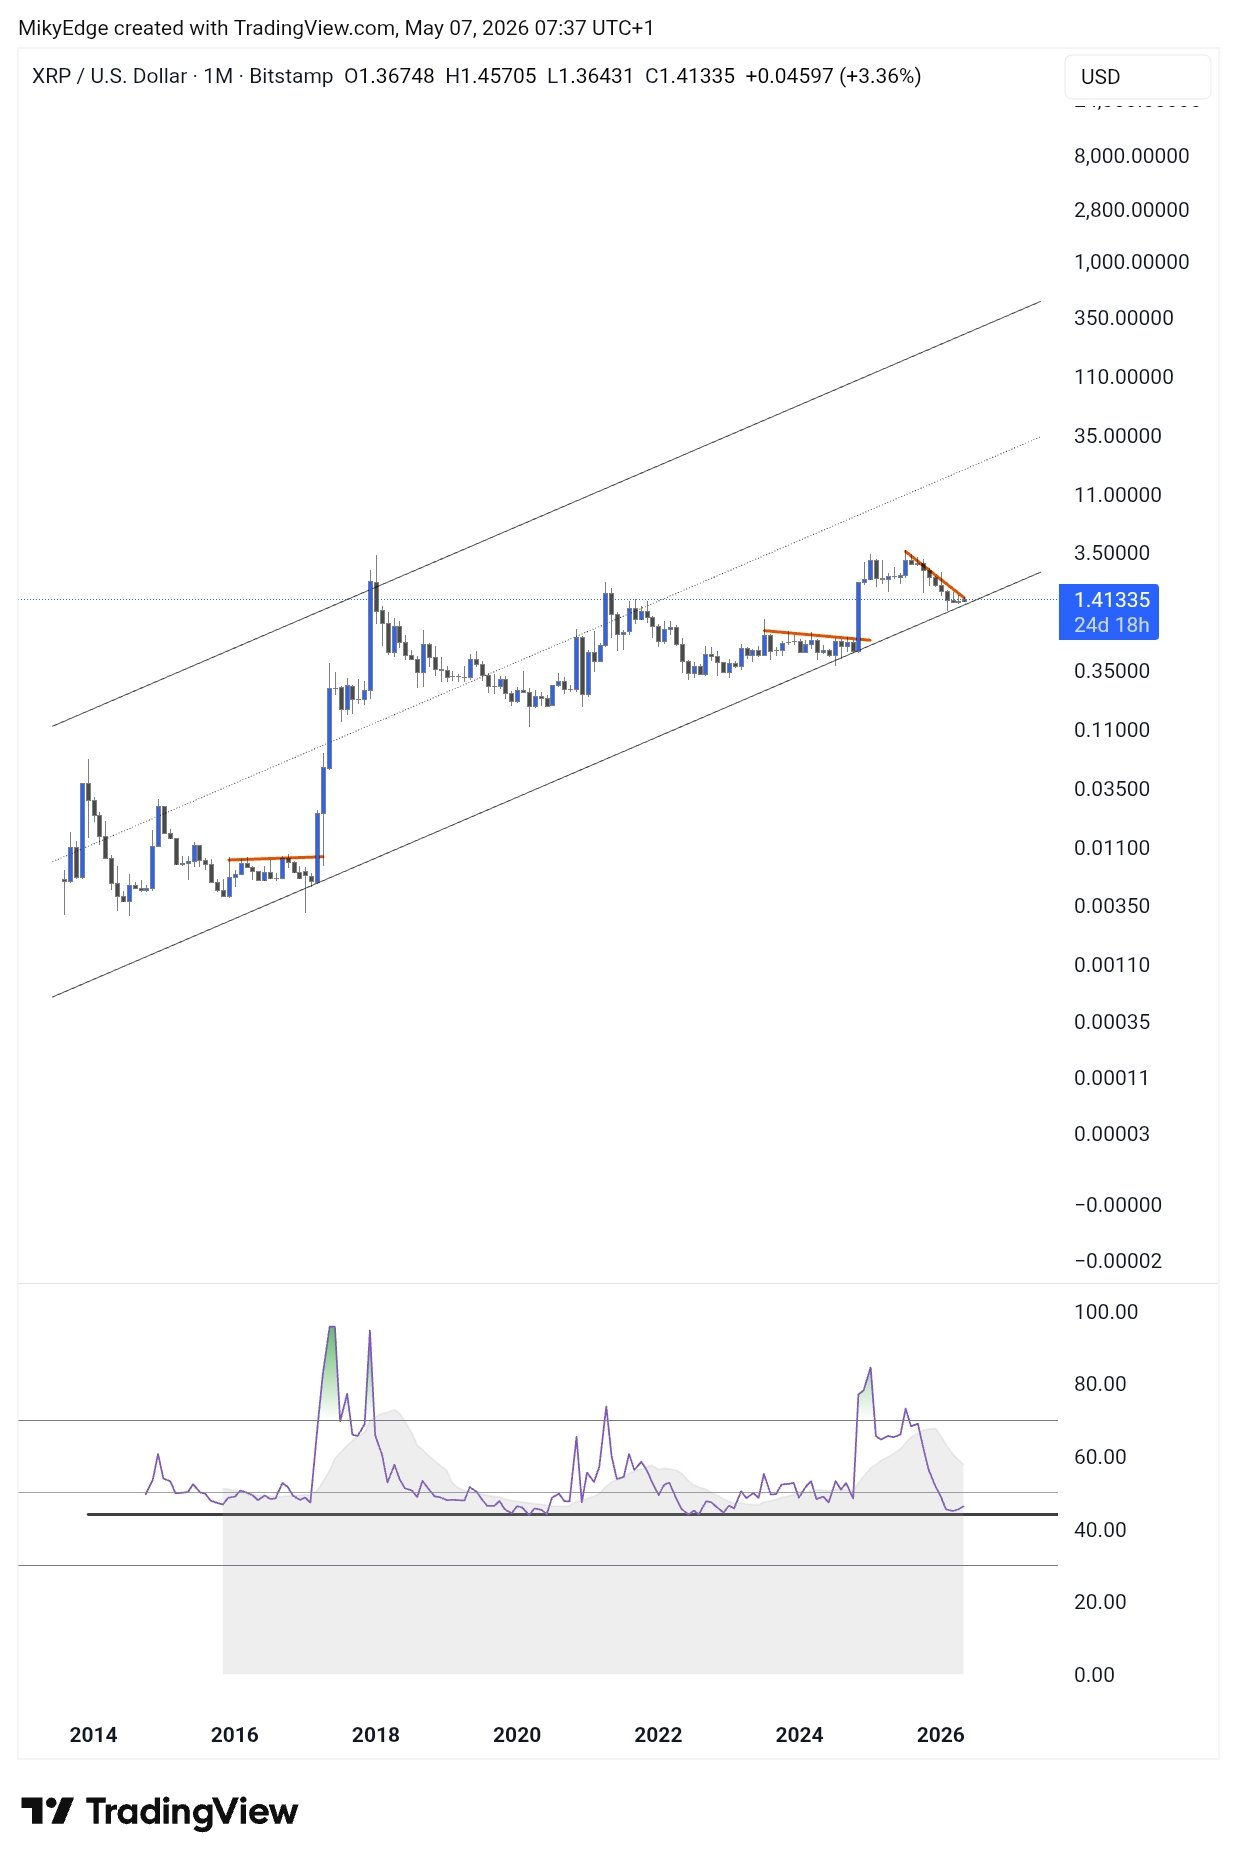
XRP/USD monthly chart. Source: TradingView/MilkybullCryptoXRP is currently sitting at one of the most significant technical levels on its long-term chart, and multiple analysts are arguing that the setup closely resembles conditions that preceded some of the token's largest historical rallies. Analyst MikybullCrypto has highlighted a monthly chart showing XRP trading inside a rising channel that has guided its price action since 2014, with the token now testing the channel's lower trendline in the $1.30–$1.40 zone. That area has historically acted as a launchpad for major upside moves, and MikybullCrypto says XRP is "probably going to $12" — a level that aligns roughly with the channel's midpoint and would represent a significant multiple from current prices. Supporting the thesis, XRP's monthly relative strength index has cooled toward the 40–45 range, a historical support zone that has appeared before past rallies according to both MikybullCrypto and analyst JD, who independently identified the same RSI zone as a potential "cycle bottom" signal in a Thursday post.JD's two-week chart adds further technical weight to the bull case. It shows XRP breaking out of a multi-year symmetrical triangle formation, then pulling back toward the breakout area — a classic retest pattern that, if it holds, projects a target zone of $8 to $14 in the next leg higher.
The bullish technical picture is backed by real fundamental momentum as well. XRP has already rebounded approximately 30% from its February lows near $1.11, driven in part by the US-Iran ceasefire improving broad risk sentiment, Rakuten Wallet's XRP integration expanding the token's reach across Japan, and a record $81.6 million in April inflows into US spot XRP ETFs — the strongest monthly total of 2026. In the first week of May alone, XRP ETFs have already attracted an additional $28.17 million in inflows, suggesting institutional demand is accelerating rather than fading.