


XRP Chart Pattern Mirrors 2017 Setup That Triggered Massive Rally
-
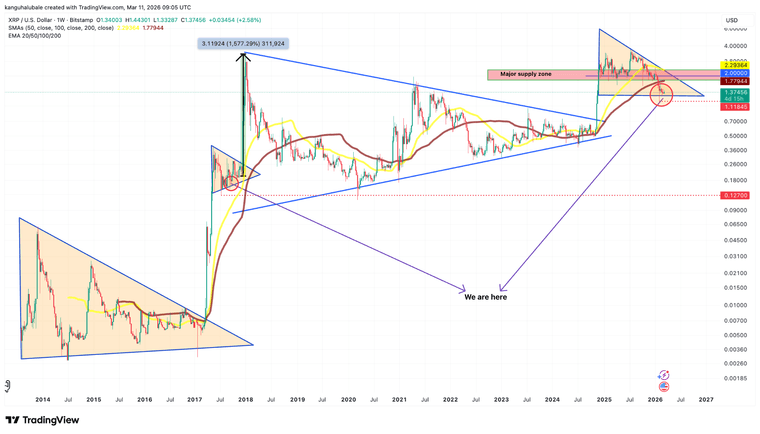
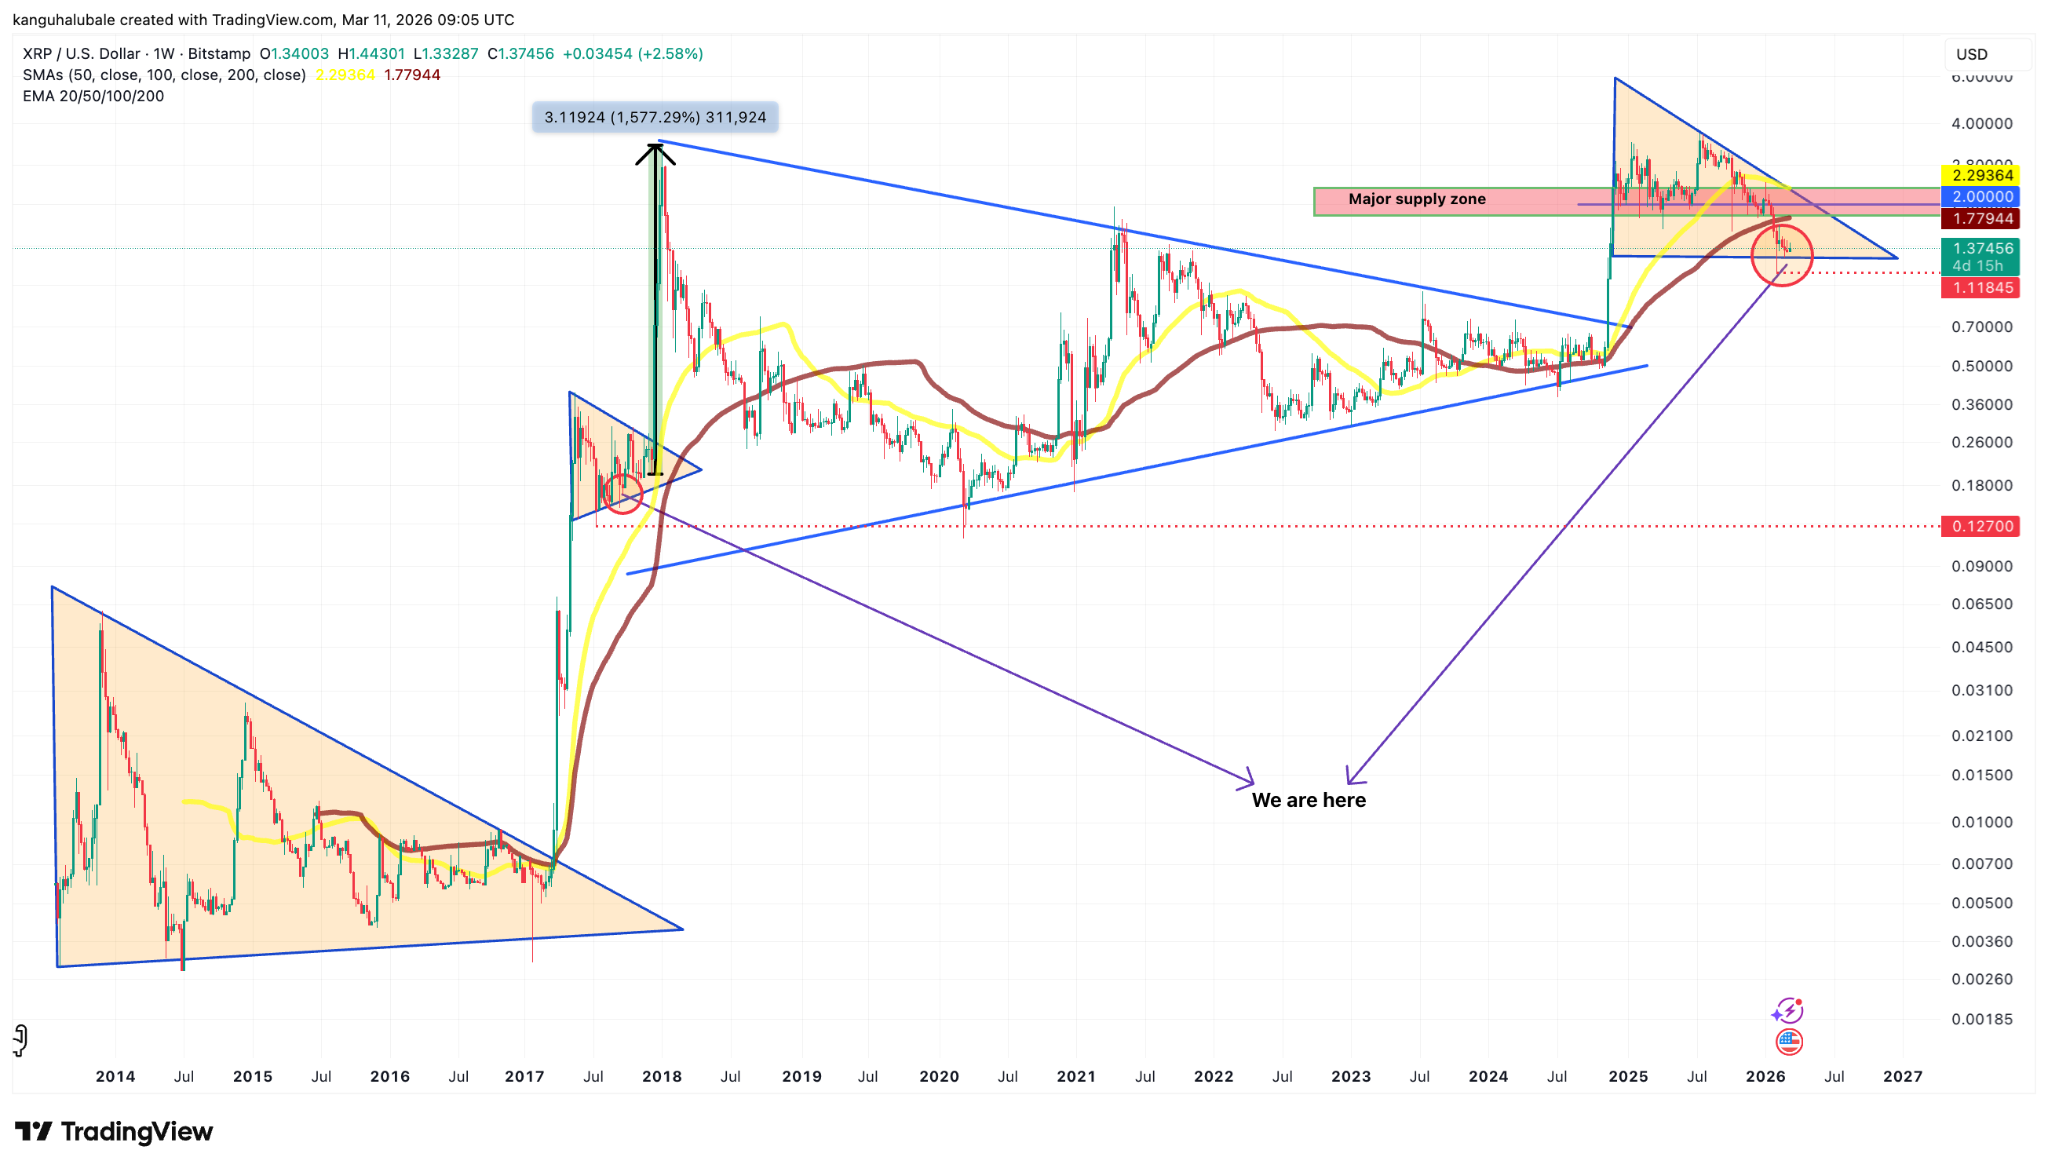
XRP/USD weekly chart. Source: Cointelegraph/TradingViewThe weekly price chart of XRP is beginning to resemble a technical pattern that previously marked a major market bottom. Analysts note that the current price structure looks similar to the 2017–2018 cycle, when XRP formed a symmetrical triangle before breaking out into a massive rally of more than 1,500%.
After falling from its multi-year high of $3.66 to around $1.10, XRP appears to be retesting the lower trendline of a similar triangle pattern. According to analyst Javon Marks, if the fractal plays out in a comparable way, the recent drop could represent a temporary pullback before a larger upward move. However, bulls will need to push XRP above the key $1.78–$2.30 resistance zone to confirm a potential breakout.