


BNB price prediction
Airdrop and Ways to earn money
2
Posts
2
Posters
14
Views
-
Sellers are attempting to defend the 50-day SMA ($873), but a positive sign is that the BNB $872.38 bulls have kept up the pressure.
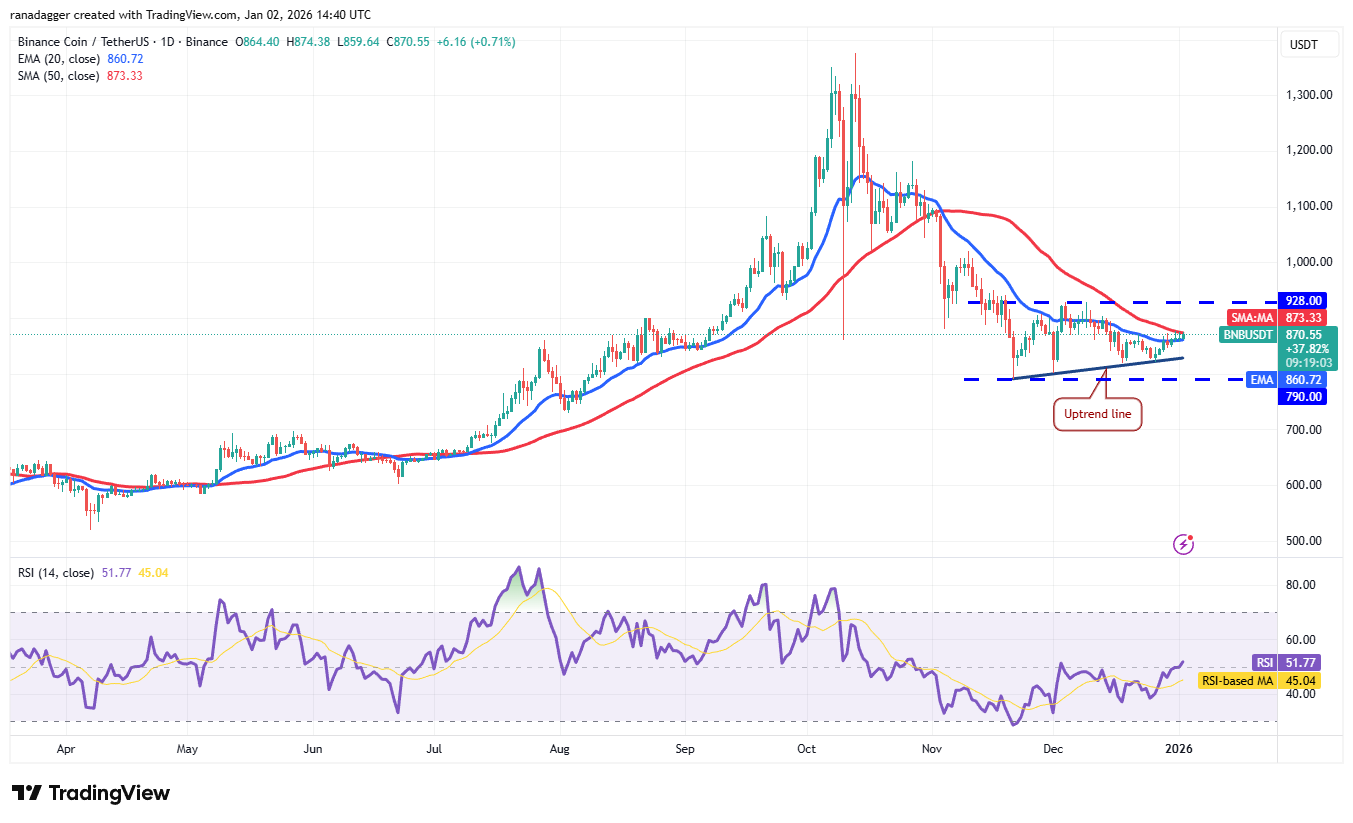
BNB/USDT daily chart. Source: Cointelegraph/TradingView
That increases the possibility of a rally to $928, where the bears are expected to step in. If buyers overcome the barrier at $928, the BNB/USDT pair will complete a bullish ascending triangle pattern. The positive setup has a pattern target of $1,066.Contrary to this assumption, if BNB turns down and breaks below the uptrend line, it suggests that the bulls have given up. The next leg of the downtrend could begin on a close below $790.
-
I think the bulls win