Skip to content
  • Categories
  • Recent
  • Tags
  • Popular
  • World
  • Users
  • Groups
Collapse
Brand Logo
UDS UDS: $2.2139
24h: -0.93%
Trade UDS
Gate.io
Gate.io
UDS / USDT
KuCoin
KuCoin
UDS / USDT
MEXC
MEXC
UDS / USDT
BingX
BingX
UDS / USDT
BitMart
BitMart
UDS / USDT
LBank
LBank
UDS / USDT
XT.COM
XT.COM
UDS / USDT
Uniswap v3
Uniswap v3
UDS / USDT
Biconomy.com
Biconomy.com
UDS / USDT
WEEX
WEEX
UDS / USDT
PancakeSwap v3
PancakeSwap v3
UDS / USDT
Pionex
Pionex
UDS / USDT
COINSTORE
COINSTORE
UDS / USDT
Sushiswap v3
Sushiswap v3
UDS / USDT
Picol
Picol
UDS / USDT

Earn up to 50 UDS per post

Post in Forum to earn rewards!

Learn more
UDS Right

Spin your Wheel of Fortune!

Earn or purchase spins to test your luck. Spin the Wheel of Fortune and win amazing prizes!

Spin now
Wheel of Fortune
selector
wheel
Spin

Paired Staking

Stake $UDS
APR icon Earn up to 50% APR
NFT icon Boost earnings with NFTs
Earn icon Play, HODL & earn more
Stake $UDS
Stake $UDS
UDS Left

Buy UDS!

Buy UDS with popular exchanges! Make purchases and claim rewards!

Buy UDS
UDS Right

Post in Forum to earn rewards!

UDS Rewards
  1. Home
  2. Trading
  3. Bullish Breakout & Fibonacci Demand Zone Analysis on XAGUSD (1H)

Bullish Breakout & Fibonacci Demand Zone Analysis on XAGUSD (1H)

Scheduled Pinned Locked Moved Trading
2 Posts 2 Posters 11 Views
  • Oldest to Newest
  • Newest to Oldest
  • Most Votes
Reply
  • Reply as topic
This topic has been deleted. Only users with topic management privileges can see it.
  • lingriidddL Offline
    lingriidddL Offline
    lingriiddd
    wrote on last edited by
    #1

    ad4fab94-b564-4e00-8f38-a6731bc721e7-image.png 
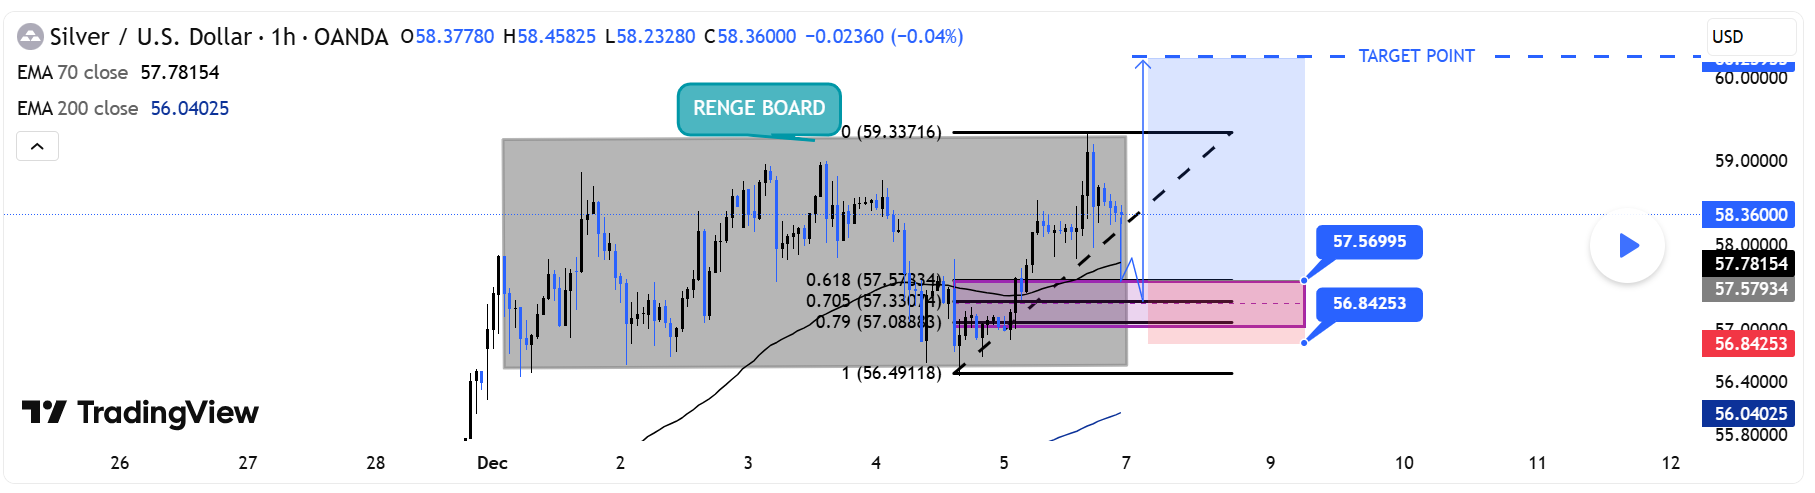
Chart Analysis (XAGUSD – 1H)

    1. Market Structure

    Price recently broke out of a large range (gray box), signaling a shift from consolidation to a potential trend.

    Breakout occurred to the upside, confirming bullish intent after multiple failed downside attempts.

    1. Fibonacci Retracement Zone

    Price retraced into a high-probability buy zone:

    0.618 – 0.79 fib levels (≈ 57.18 – 57.08)

    This area aligns with:

    Previous support inside the range

    The rising short-term trendline

    EMA confluence

    This creates a strong demand zone (highlighted in pink).

    1. EMAs (Trend Confirmation)

    EMA 70 > EMA 200, indicating a bullish market structure.

    Price is currently above both EMAs → trend momentum favors buyers.

    1. Liquidity & Smart Money Concepts (SMC)

    Liquidity above recent range highs was taken (stop hunt), then price retraced to fill imbalance.

    Current demand zone appears to be a reaccumulation block, suggesting smart money may defend this zone.

    1. Entry, Stop & Target

    Potential buy entry: 57.33 – 57.10 zone

    Stop-loss: Below 56.84

    Target: 60.23 – 60.25 (blue target zone)

    This offers a favorable risk-to-reward based on breakout continuation.

    1. Momentum Outlook

    Bullish continuation is likely if price holds above 57.10 and breaks minor structure highs.

    A break below 56.84 invalidates bullish setup and may retest lower EMA or range midpoint.

    📌 Summary
    The chart shows a bullish breakout from a long consolidation range, with price retracing into a strong demand/Fibonacci zone that aligns with trend indicators. If buyers defend the zone, price has room to rally toward 60.25, completing the projected bullish extension.

    1 Reply Last reply
    0
    • Nahid HossenN Offline
      Nahid HossenN Offline
      Nahid Hossen
      wrote on last edited by
      #2

      Silver tapped the demand zone perfectly—fib levels lining up well.

      Nike

      1 Reply Last reply
      0


      • Login or register to search.
      Powered by NodeBB Contributors
      • First post
        Last post
      0
      • Categories
      • Recent
      • Tags
      • Popular
      • World
      • Users
      • Groups