


Technical Signals Hint at Possible ZEC Pullback
Airdrop and Ways to earn money
3
Posts
3
Posters
22
Views
-
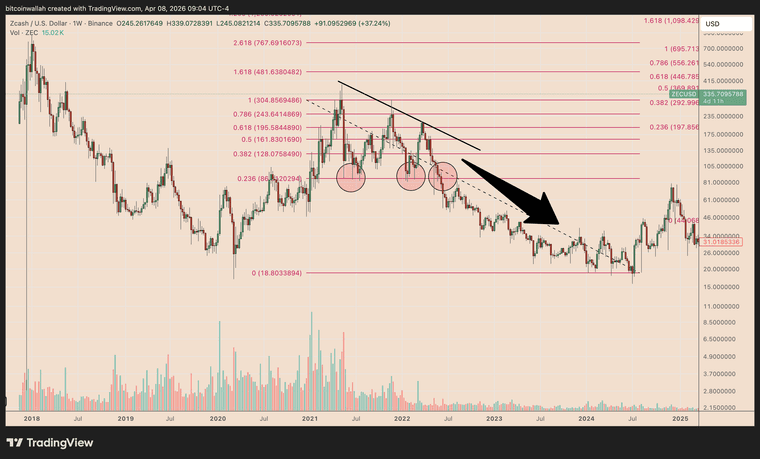
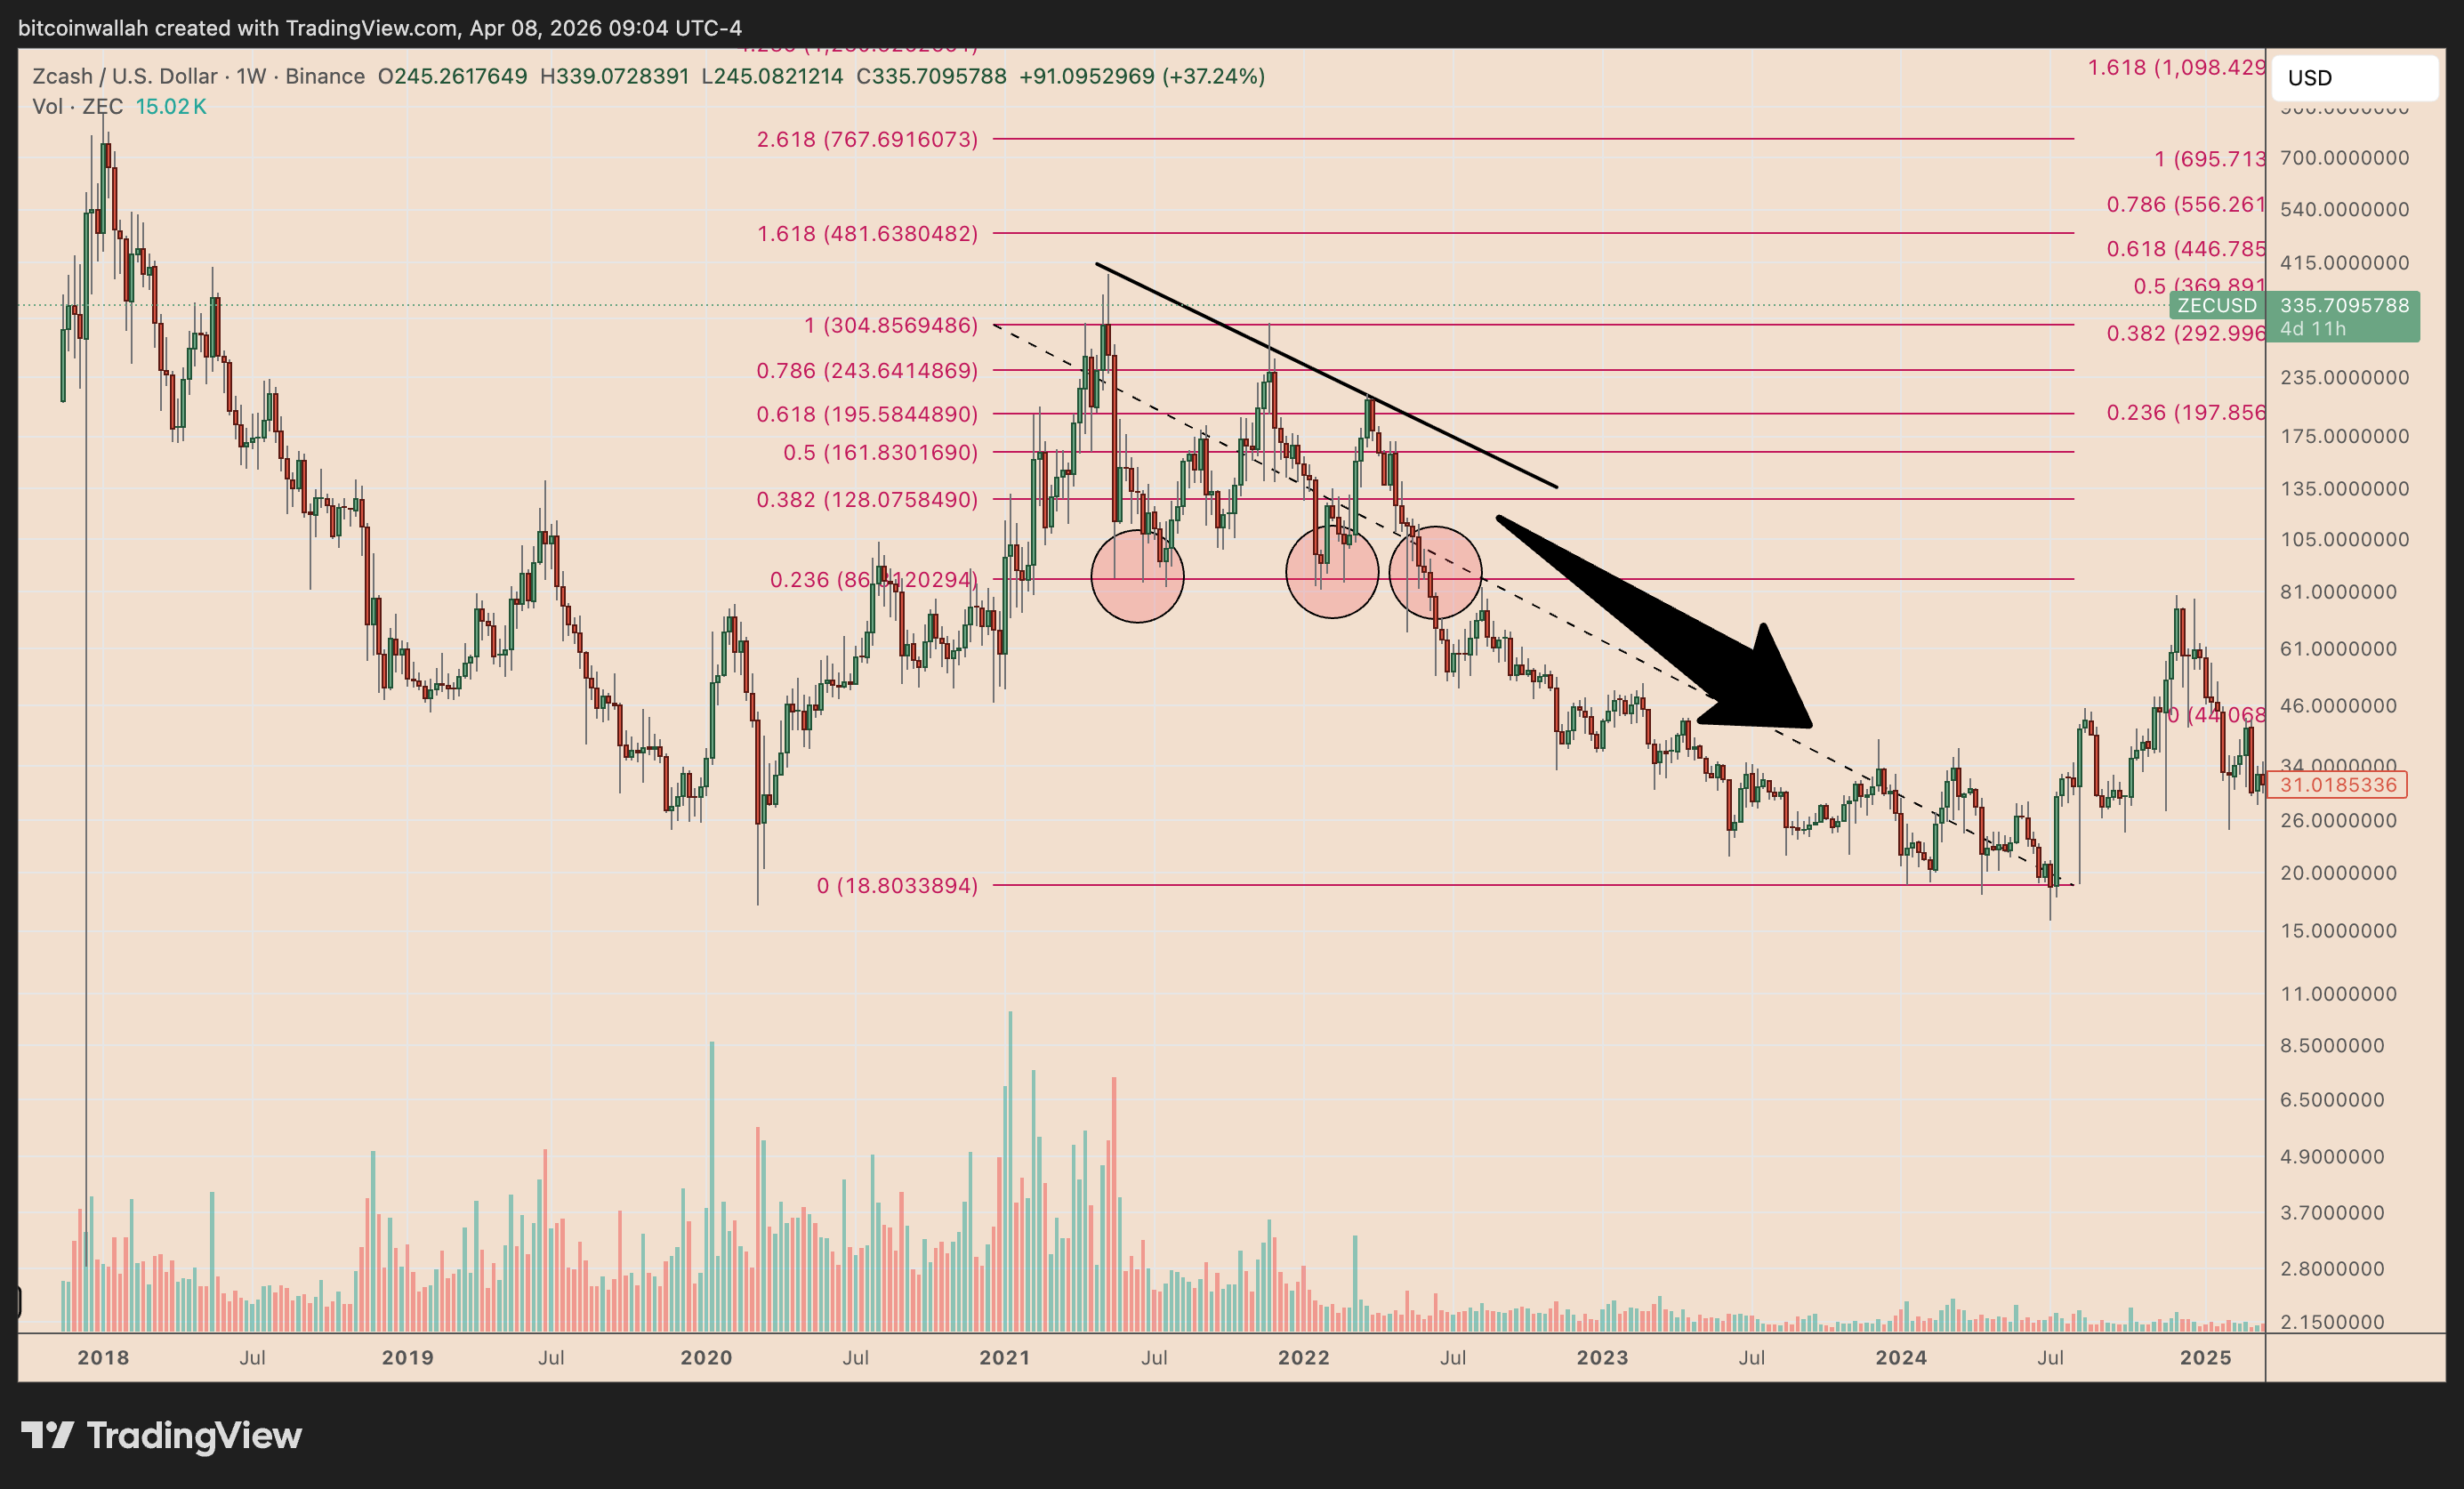
ZEC/USD weekly chart. Source: TradingViewZcash’s current price structure mirrors a past bearish cycle, with resistance forming along a descending trendline and support near the $197–$200 range. While a breakout above $370 could open the door for a much larger rally, failure to break resistance may trigger a sharp correction.
On the flip side, a confirmed breakout could activate a bullish “falling wedge” pattern, potentially sending ZEC toward $1,000+ levels as some analysts have predicted. This creates a high-risk, high-reward scenario where traders must closely watch trendline resistance and volume confirmation before making directional bets.
