


XRP Chart Pattern Mirrors 2017 Setup That Led to a Massive Rally
-
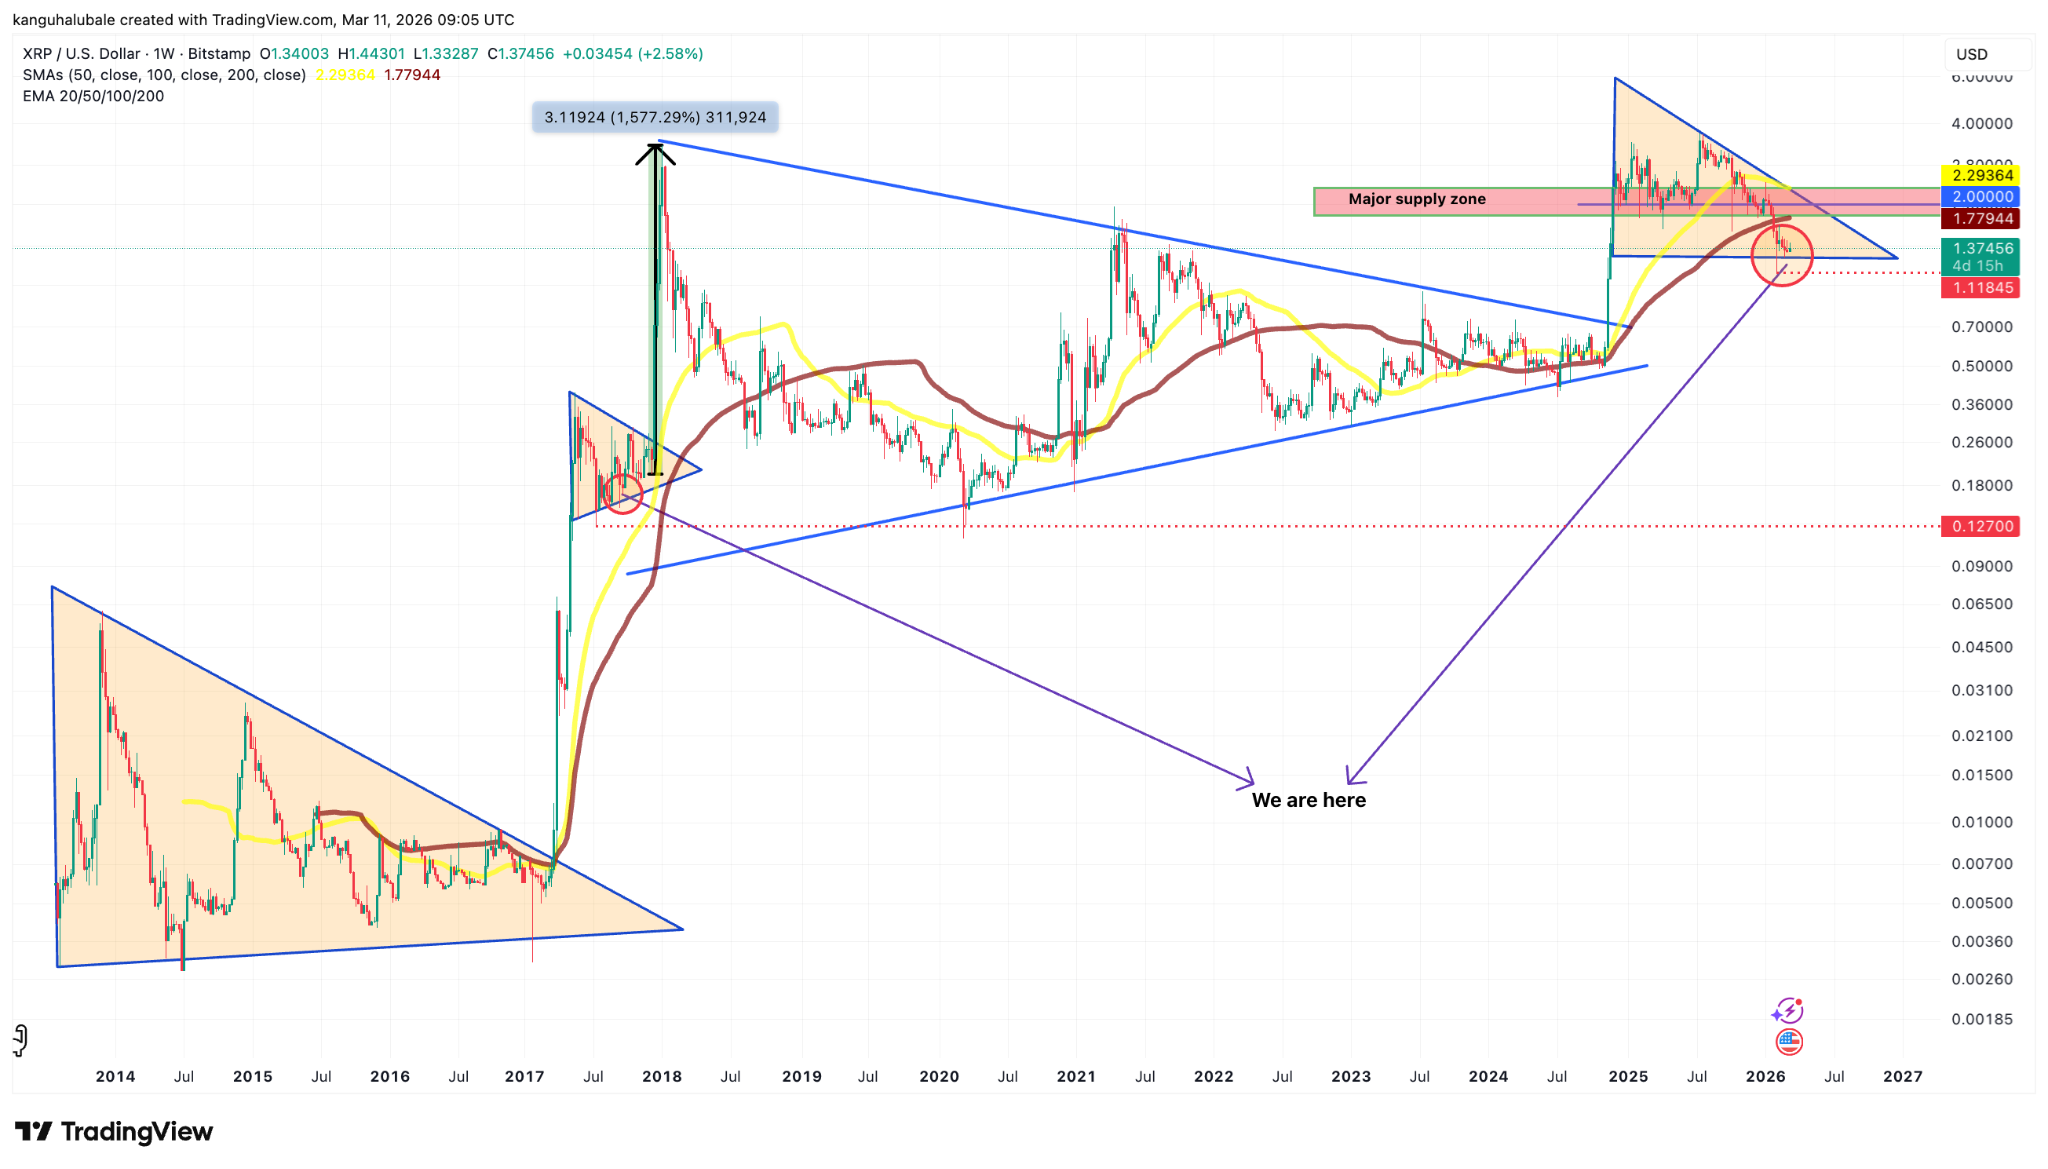
XRP/USD weekly chart. Source: Cointelegraph/TradingViewmay be showing signs of a major technical setup similar to the pattern that preceded its explosive rally in 2017. Analysts note that the current weekly chart resembles the symmetrical triangle formation seen during the previous cycle, when XRP dropped sharply before launching into a 1,577% surge. After falling from its recent highs near $3.66 to around $1.10, the price now appears to be testing a similar long-term support structure.
For bullish momentum to return, XRP would need to break above the key resistance zone between $1.78 and $2.30. This area represents a major technical barrier where multiple indicators converge. If buyers manage to push the price above this level and sustain it, some analysts believe the market could shift into a new long-term uptrend.
-
crypto analysts: draws triangle
twitter: THIS IS IT BOYS