


Bullish Divergences Signal Potential Bitcoin Rebound
-
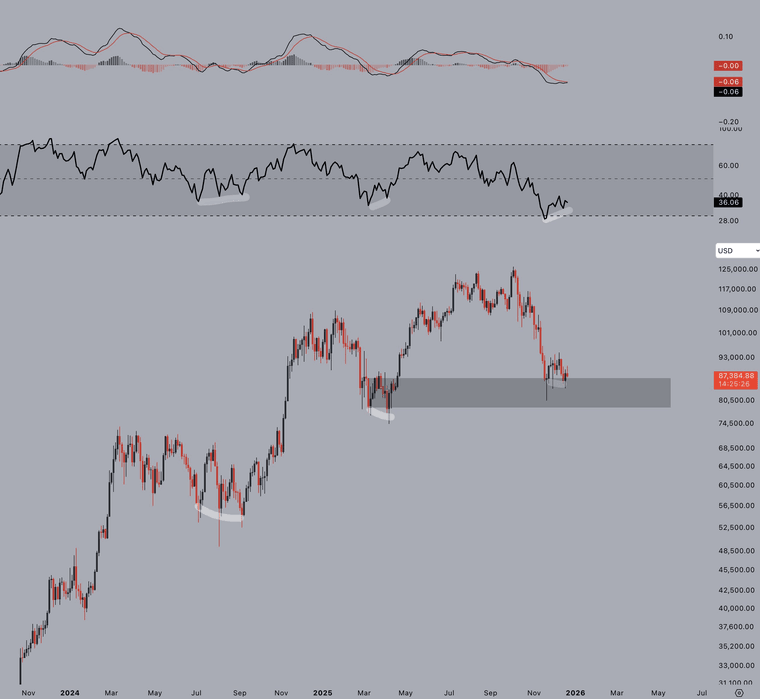
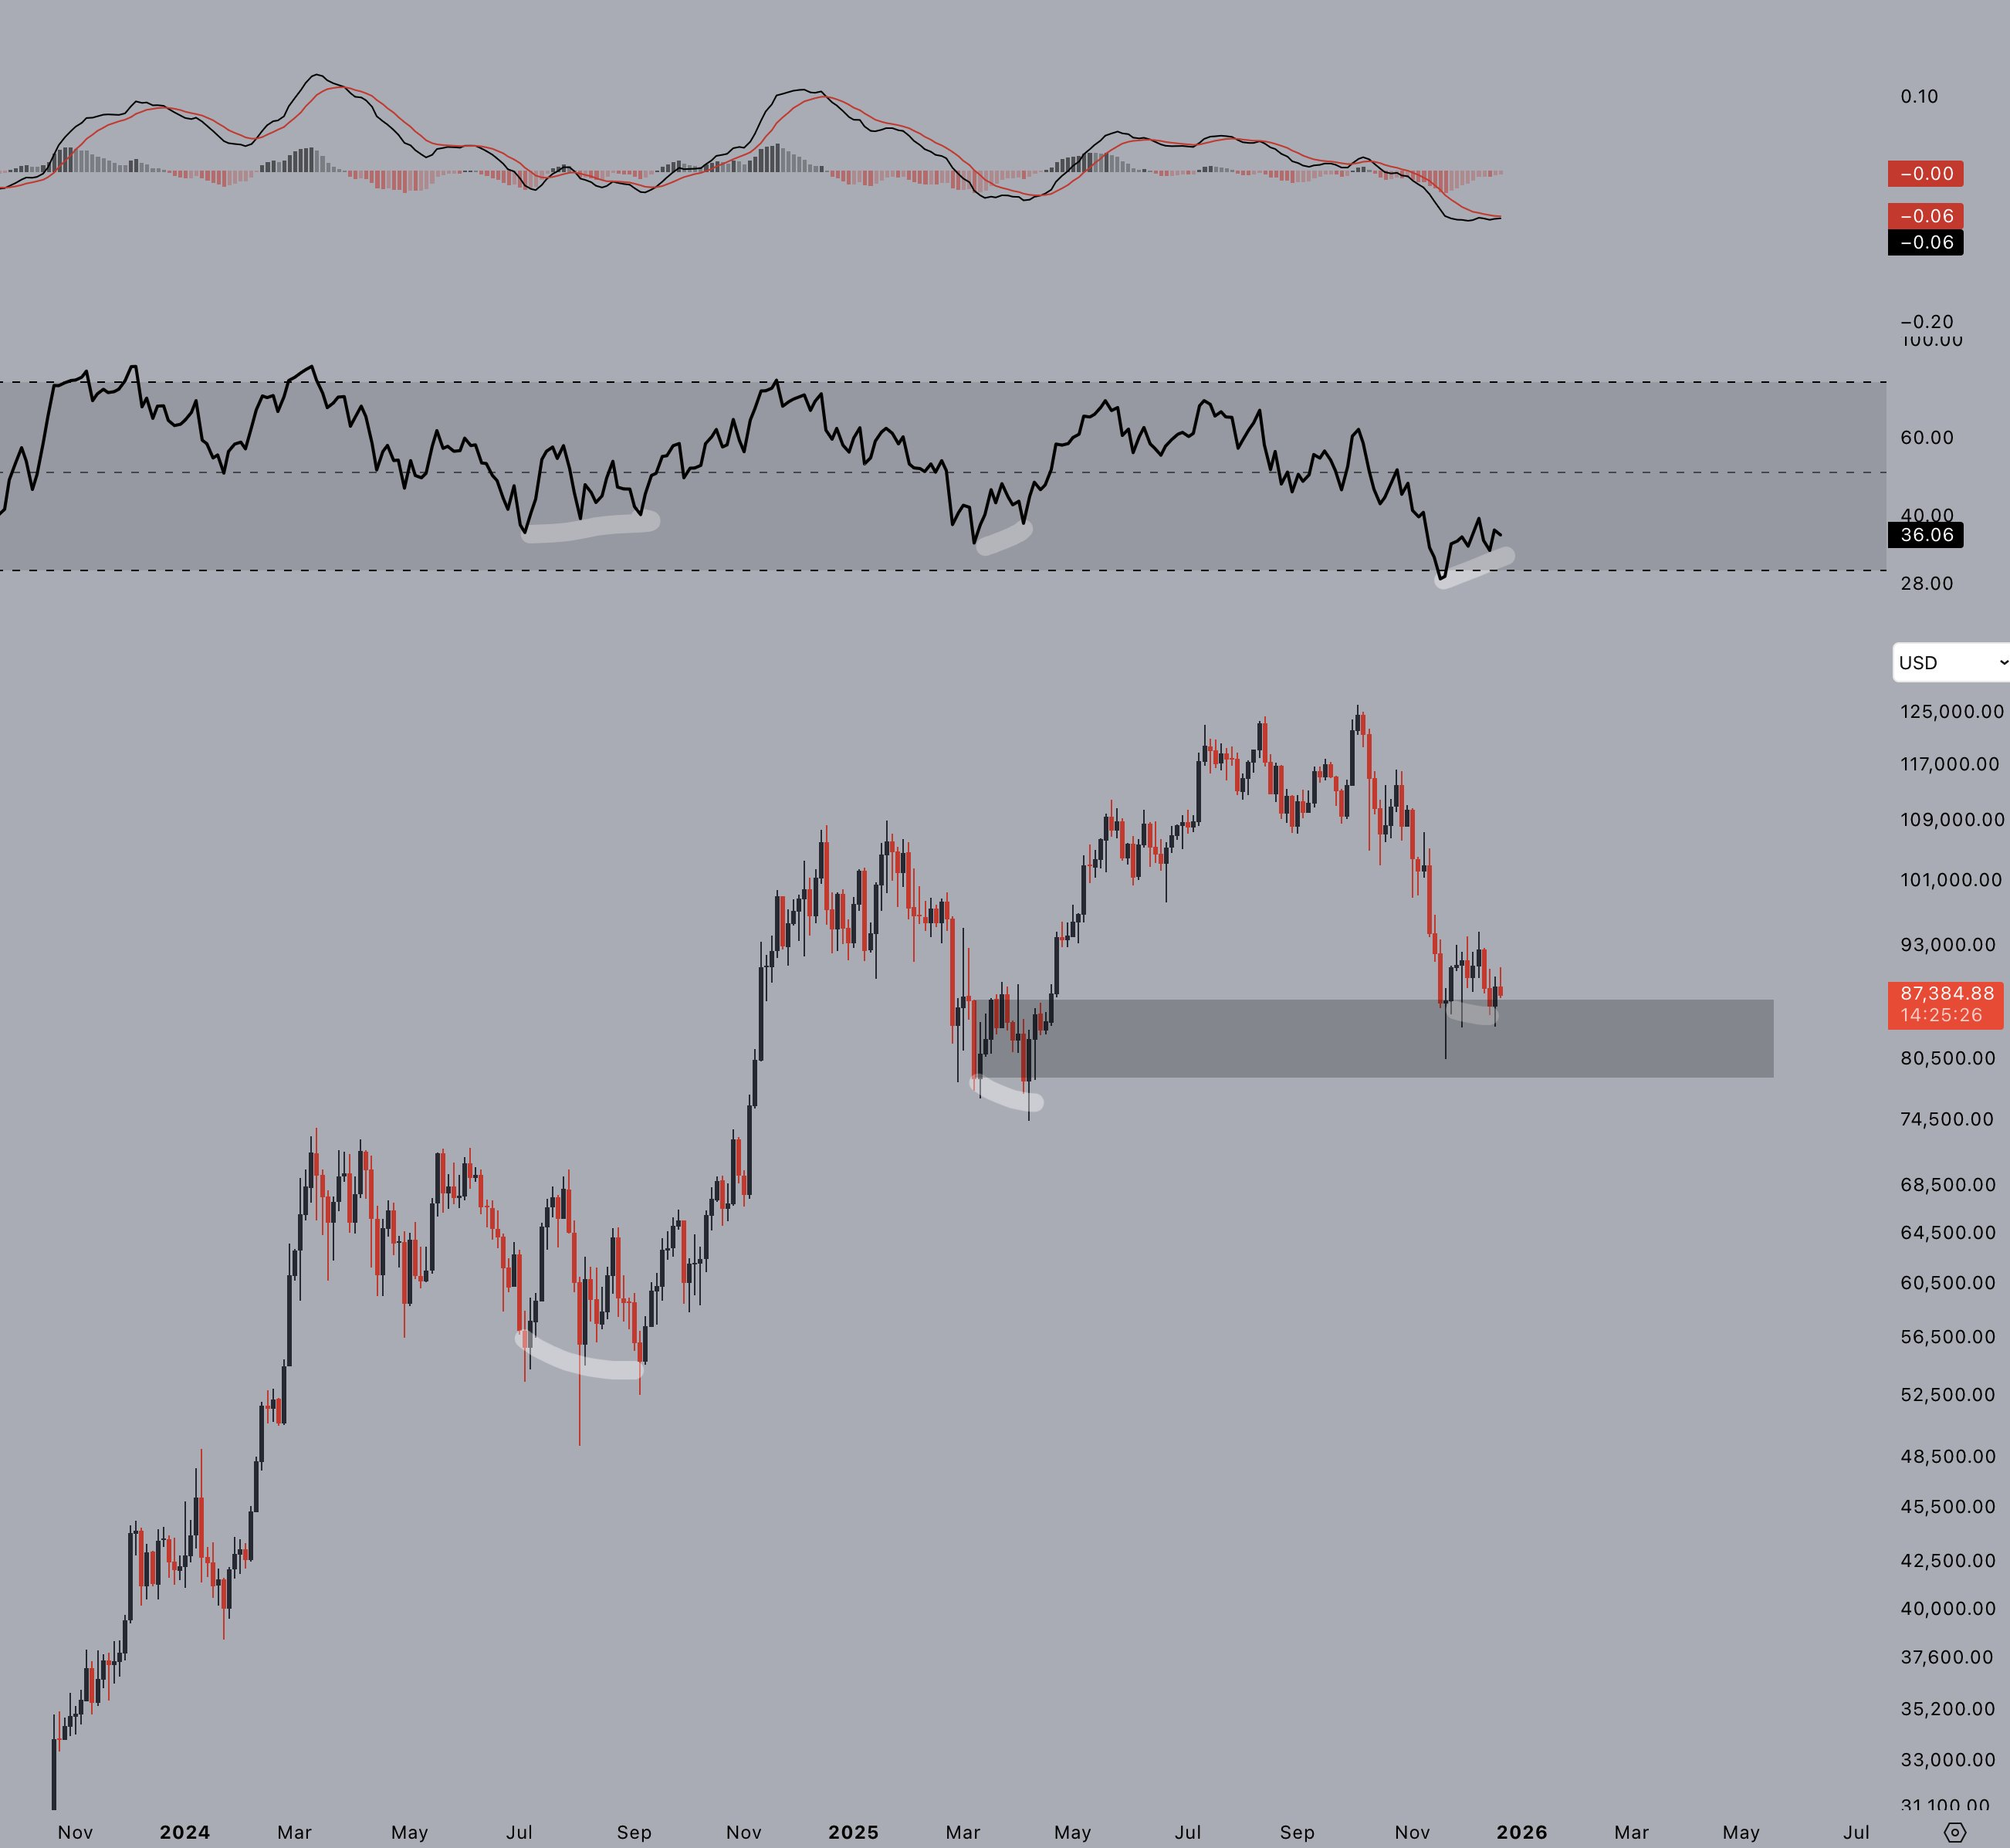
BTC/USD chart with RSI, MACD data. Source: Jelle/XDespite Bitcoin’s recent struggles, analysts are spotting bullish signs. On the three-day chart, BTC’s RSI is forming higher lows while the price hits lower lows—a classic bullish divergence. Traders like Jelle suggest this pattern could indicate a bottom, potentially paving the way for BTC to retest six-figure territory.
Gold’s record highs near $4,500 per ounce have further highlighted BTC’s range-bound behavior. On the BTC/XAU chart, a bullish divergence is forming at key support levels, hinting at a potential rebound.
As liquidity thins and traders close positions ahead of Christmas, Bitcoin’s price action remains delicate—but the technical signals point to a possible comeback for the flagship crypto.
-
should have invested in XAU