


Bitcoin Cash price prediction
Airdrop and Ways to earn money
2
Posts
2
Posters
16
Views
-
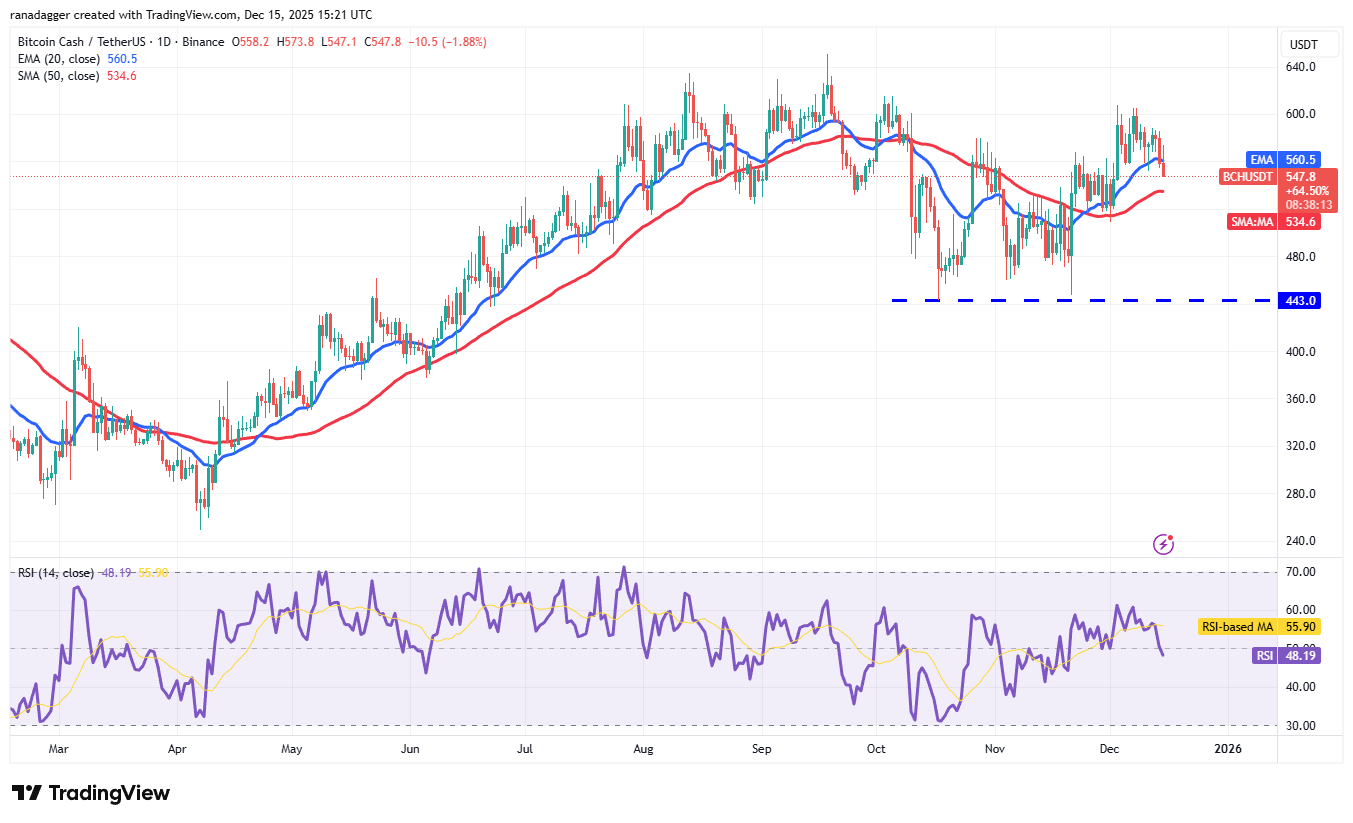
Bitcoin Cash BCH $545.86 has broken below the 20-day EMA ($560), indicating that the bulls are losing their grip.
BCH/USDT daily chart. Source: Cointelegraph/TradingView
The next support on the downside is the 50-day SMA ($534) and then $508. Such a move suggests that the Bitcoin Cash price may oscillate inside the $443 to $615 range for some more time.Buyers will have to drive and maintain the price above the $615 level to signal the resumption of the up move. The BCH/USDT pair may then challenge the crucial overhead resistance at $651.
-
Something doesn’t add up here. Need more clarity.