


Bitcoin price prediction
-
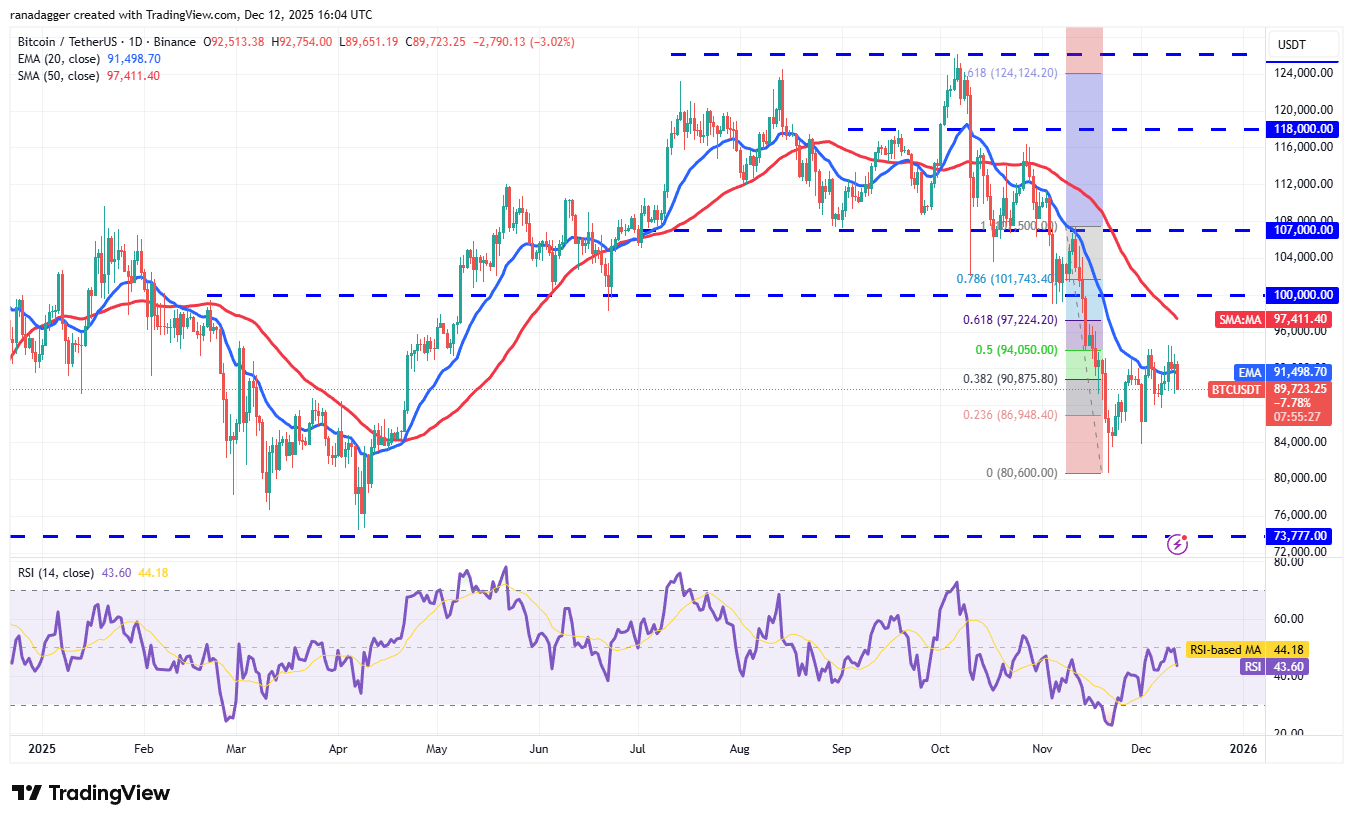
BTC/USDT daily chart. Source: Cointelegraph/TradingViewBTC’s recovery is facing resistance at the 50% Fibonacci retracement level of $94,050, indicating that the bears are active at higher levels.
BTC/USDT daily chart. Source: Cointelegraph/TradingView
There is support at $87,700 and then at $84,000. A break below the $84,000 level opens the gates for a retest of the Nov. 21 low of $80,600.Buyers will need to push the Bitcoin price above the $94,050 resistance level to signal strength. The BTC/USDT pair may then climb to the 50-day simple moving average (SMA)($97,411).
The up move is expected to face significant selling in the zone between the 50-day SMA and the psychological level of $100,000. A close above $100,000 indicates that the bulls are back in the game.
-
Bitcoin’s next move will likely be driven by liquidity and macro signals.
-
Long-term structure remains intact despite short-term volatility.