


BNB price prediction
-
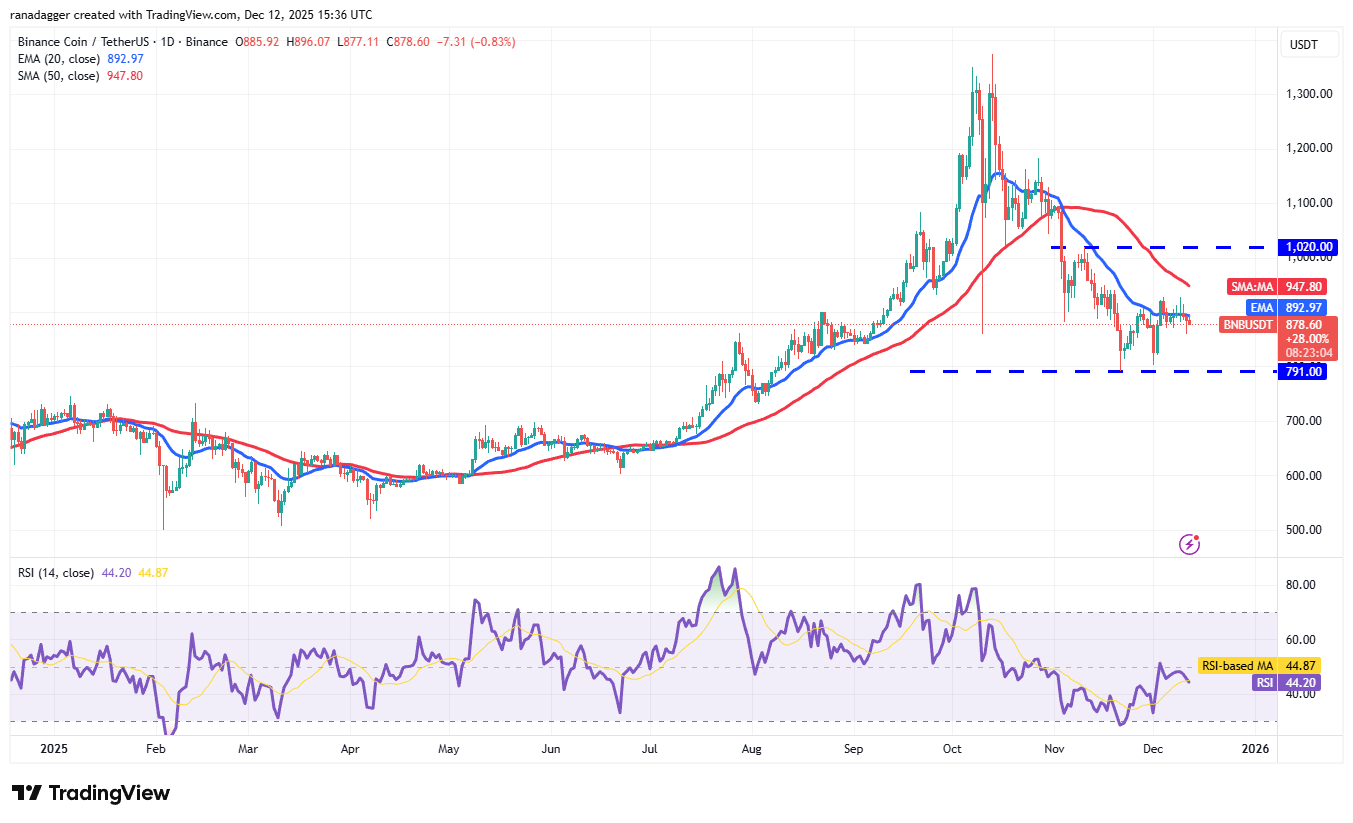
BNB $892.60 has been trading near the 20-day EMA ($892) for the past few days, indicating equilibrium between buyers and sellers.
BNB/USDT daily chart. Source: Cointelegraph/TradingView
The flattish 20-day EMA and the RSI just below the midFpoint suggest a range-bound action between $791 and $1,020 for the next few days.
Sellers will have to sink the BNB price below the $791 level to start the next leg of the downtrend. The BNB/USDT pair may then collapse to $730. On the upside, a close above $1,020 indicates that the correction may be over. The pair could then rally to $1,182, which may act as a resistance.
-
BNB remains closely tied to ecosystem utility and exchange activity.
-
Stability above support could strengthen confidence among long-term holders.