


#Litecoin update: $LTC dipped to $83, hit the $76–$88 demand zone, and bounced to $91 as predicted! Buyers defending strong, bullish structure intact above $88. Next targets: $100, $114, $120. Momentum building for a $100+ push! Who's riding this? #Crypto #LTC #Trading #ArmanShabanTrading
Arman Shaban
@Arman Shaban
Posts
-
Let's Trade Crypto with #Arman ! (JOIN THE TOPIC) -
Let's Trade Crypto with #Arman ! (JOIN THE TOPIC)#Bitcoin update: $BTC failed to hold $110K, crashed to $103,500, then rebounded to $107,300 on strong demand from $103K–$105K zone. Must reclaim $110K for bullish momentum, or rejection at $109,600 risks deeper pullback. Neutral-to-bullish, high volatility—watch for breakout or liquidity sweep! Who's trading this? #Crypto #BTC #Trading #ArmanShabanTrading
-
Let's Trade Crypto with #Arman ! (JOIN THE TOPIC)#Cardano update: $ADA hit $0.7360, fell to $0.5915, now at $0.63. Holding $0.58–$0.63 support, still in correction phase. No bullish signals yet—wait for reversal! Targets: $0.75, $0.85, $1.00. Who's watching? #Crypto #ADA #Trading #ArmanShabanTrading
-
Gold Drops +1,000 Pips, Then Recovers – $4,300 Next?Re: [$Gold Smashes Another ATH – Eyes on $4](350 Next!)
By analyzing the Gold (XAUUSD) chart on the 15-minute timeframe, we can see that after rising to $4,294, gold suddenly faced a sharp drop of over 1,000 pips, falling to $4,185. After dipping below that level, it found strong demand and finally closed the weekly candle at $4,253.975.
The current price zone acts as an important supply area, and I expect an initial reaction from this level when the market reopens on Monday, followed by a potential strong breakout above $4,300.
Hope you all made the most out of this week’s moves — have a great weekend, everyone! Join Our Telegram Channel for expert analysis, real-time signals, powerful trading tips, and to master trading like a PRO : t.me/PriceAction_ICT
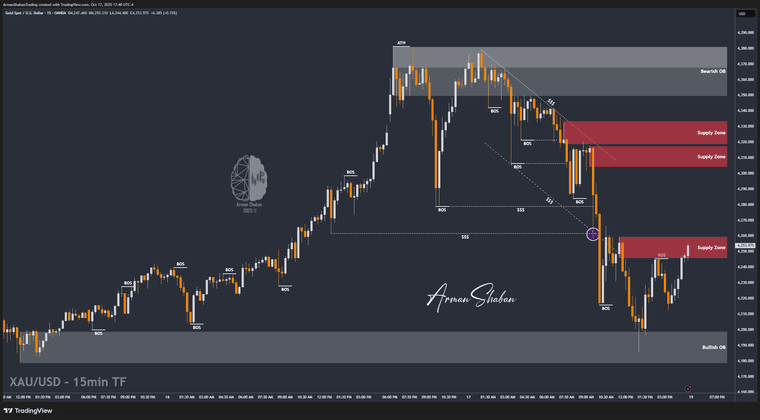
#XAUUSD #GOLD #FOREX
-
$Cardano (ADA) Update – Consolidation Deepens, Patience Required!By analyzing the #Cardano (ADA) chart on the 3-day timeframe, we can see that after climbing to $0.7360, ADA faced renewed selling pressure and dropped as low as $0.5915. It’s now trading around $0.63, holding near a mid-range zone within its broader structure.
While the overall market sentiment remains mixed, ADA’s chart suggests that it’s still in a correction and accumulation phase. The $0.58–$0.63 zone is currently acting as a minor support area, but there are no strong bullish signs yet — meaning price might continue to consolidate for a while before its next major move.
Once momentum returns, ADA could still target $0.75, $0.85, and even $1.00, but for now, traders should stay patient and watch for clearer reversal signals before re-entering aggressively.
Join Our Telegram Channel for expert analysis, real-time signals, powerful trading tips, and to master trading like a PRO : t.me/PriceAction_ICT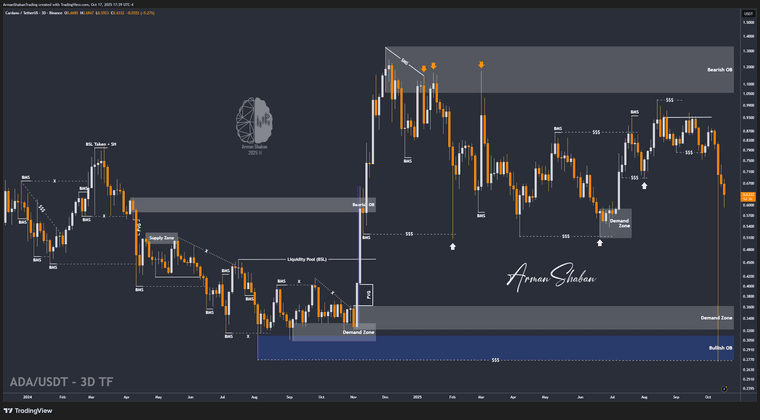
#ADA #Cardano #Crypto #ArmanShabanTrading #PriceAction
-
$Bitcoin (BTC) Update – Critical Retest After Sharp Drop!Re:
 Bitcoin Holding Strong Above $110K – Breakout Loading?
By analyzing the #Bitcoin (BTC) chart on the 12-hour timeframe, we can see that BTC failed to sustain above the $110K level and faced a sharp sell-off, dropping to around $103,500. However, strong buying pressure quickly stepped in, driving the price back up toward $107,300.
This reaction confirms that the $103K–$105K zone is still acting as a major demand area. For now, BTC needs to reclaim and hold above $110K to regain bullish momentum. Otherwise, another rejection near $109,600 could trigger a deeper pullback.
The overall structure remains neutral-to-bullish, but volatility is high — you should watch closely for a confirmed breakout or a possible liquidity sweep before the next leg develops.
Join Our Telegram Channel for expert analysis, real-time signals, powerful trading tips, and to master trading like a PRO : t.me/PriceAction_ICT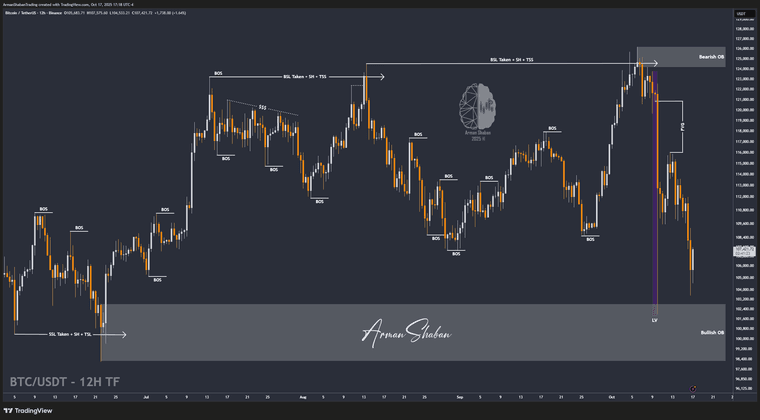
-
Litecoin (LTC) Update – Demand Zone Reacts Again!Re: $LTC Holding Strong Above Support – Breakout Incoming?
By analyzing the #Litecoin (LTC) chart on the weekly timeframe, we can see that after the recent market-wide correction, LTC dropped to around $83, perfectly testing the $76–$88 demand zone highlighted in the previous analysis.
As expected, this area attracted strong buying pressure, pushing the price back up toward $91, confirming that buyers continue to defend this key zone.The overall structure remains bullish — as long as LTC holds above $88, the outlook stays intact. The next upside targets are $100, $114, and $120, where the market could face short-term resistance before another possible breakout.
This bounce once again demonstrates Litecoin’s technical strength and the reliability of its long-term demand area. If momentum continues, we could soon see another push toward the $100 mark.
Join Our Telegram Channel for expert analysis, real-time signals, powerful trading tips, and to master trading like a PRO : [t.me/PriceAction_ICT]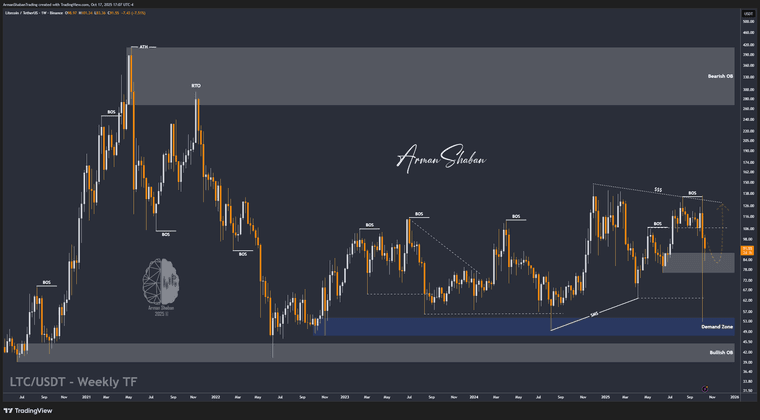
#LTC #Litecoin #Crypto #ArmanShabanTrading #PriceAction
-
XAU/USD | First LONG, then SHORT! (READ THE CAPTION)Re: [$Gold Smashes Another ATH – Eyes on $4](350 Next!)
By analyzing the Gold (XAUUSD) chart on the 15-minute timeframe, we can see that gold hit all targets between $4,300 and $4,350 and even rallied to $4,380.99, marking a new all-time high (ATH)!
After that, gold started to correct below $4,300, briefly dipping to $4,258 before bouncing back above $4,285. I expect that if the price moves into the $4,300–$4,317 zone, we may see a negative reaction or rejection from this area.
If that scenario plays out, gold could drop toward $4,250 as its first key target.
Keep a close eye on these levels — and if you have questions about gold’s trend, feel free to leave a comment using the link below!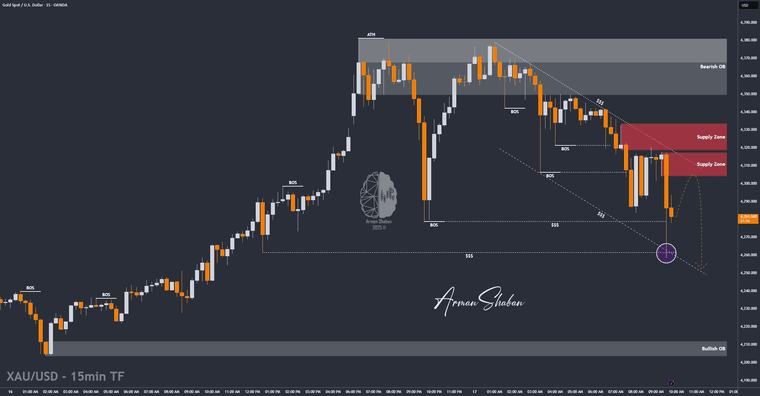
-
$Gold Smashes Another ATH – Eyes on $4,350 Next!Right now, Gold doesn’t have a very interesting chart to analyze since there’s been no major change in market structure.
However, just minutes ago, gold set a new all-time high (ATH), reaching $4,258, and I expect it to continue climbing toward the $4,300–$4,350 zone soon.
The key demand zones to watch are $4,203–$4,211, $4,140–$4,146, and $4,090–$4,100.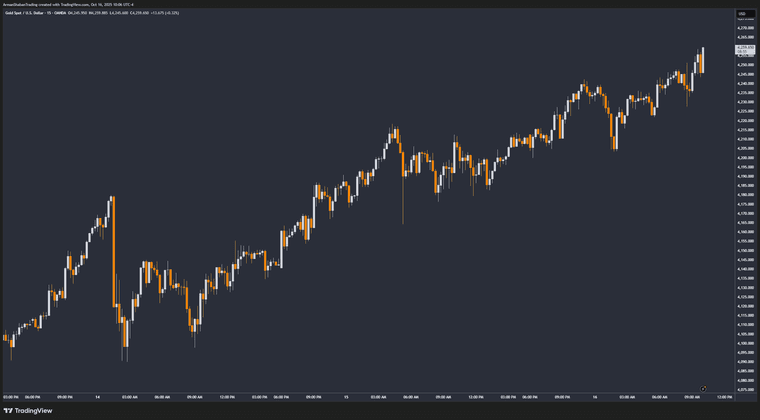
-
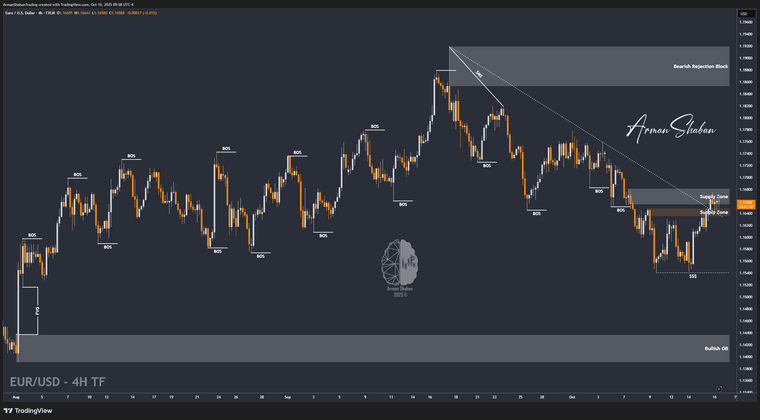
EUR/USD Testing 1.166 – Rejection or Breakout Ahead?Re: EURUSD Breakdown Alert: Could It Drop Toward 1.1565?
By analyzing the EUR/USD chart on the 2-hour timeframe, we can see that the price is currently testing the 1.166 supply zone. We need to watch if it gets rejected from this level — a strong rejection could lead to a deeper drop toward the 1.160, 1.158, and 1.1565 targets. However, if the price breaks and holds above 1.168, this bearish outlook will no longer be valid.
-
$LTC Holding Strong Above Support – Breakout Incoming?By analyzing the #Litecoin (LTC) chart on the weekly (logarithmic) timeframe, we can see that the price has risen to $100, successfully hitting the first target from the previous analysis.
Currently, LTC is trading around $96, and it’s important to see whether the price can hold above the $76–$88 support zone.
If it does, we could expect a strong bullish move ahead.
The next targets are $114 and $120.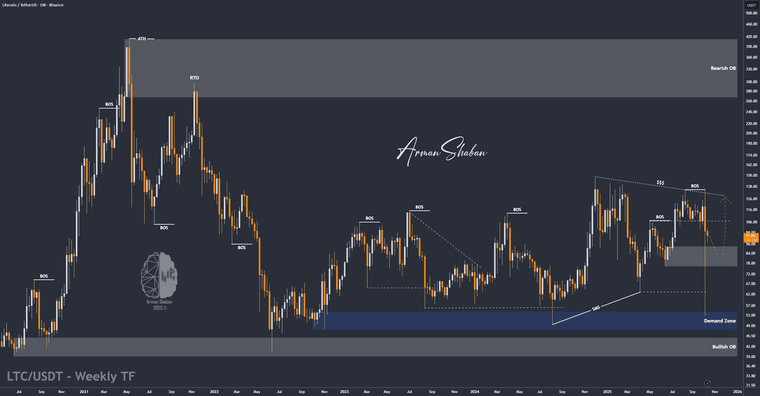
-
EURUSD Breakdown Alert: Could It Drop Toward 1.1565?@Swipe Exactly bro
 1.164 is the key line in the sand — if it holds below, momentum should carry us straight toward those lower targets. Let’s see if the bears keep control this time
-
Powell Just Lit the Fuse — Markets Are Heating Up!@m_c_jacob True, it’s more of a signal than a confirmation for now — but markets tend to price in hope before the facts hit
 let’s see how Powell’s next speech shapes sentiment.
 -
Powell Just Lit the Fuse — Markets Are Heating Up!@Swipe Exactly bro, that’s what it feels like — liquidity could flood back in fast if QT truly pauses. Wouldn’t be surprised to see a “mini bull phase” kick off soon


-
🚀 Bitcoin Holding Strong Above $110K – Breakout Loading?By analyzing the Bitcoin (BTC) chart on the 12-hour timeframe, we can see that the price is still trading around $111,000, showing positive reactions near the $110,000 support zone.
Although we haven’t seen strong momentum yet, I expect a bullish move soon.
The key demand zone remains between $109,000 and $110,000, and the next upside targets are $113,800, $116,000, $119,600, and $120,800.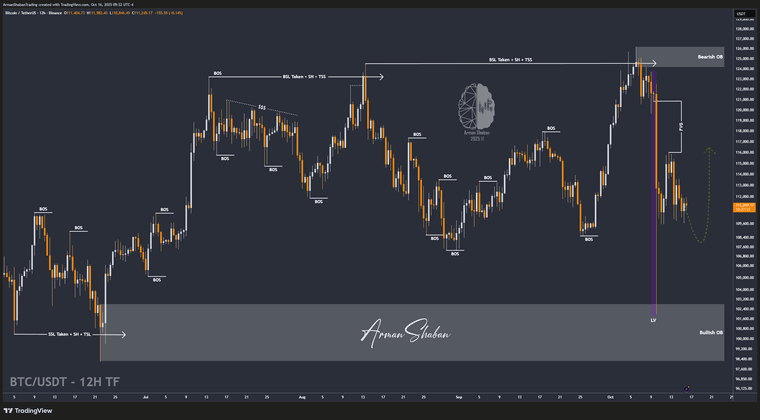
-
EURUSD Breakdown Alert: Could It Drop Toward 1.1565?By analyzing the EUR/USD chart on the 2-hour timeframe, we can see that the price is currently trading around 1.162.
If it manages to hold below the 1.164 level, we could expect further downside movement from the Euro.
The next potential bearish targets are 1.160, 1.158, and 1.1565.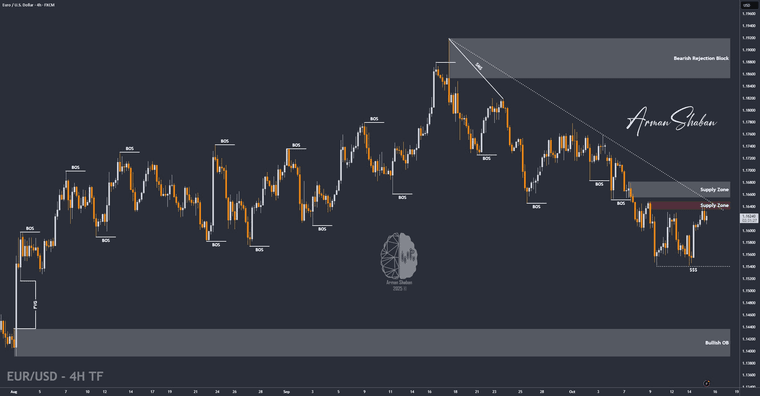
-
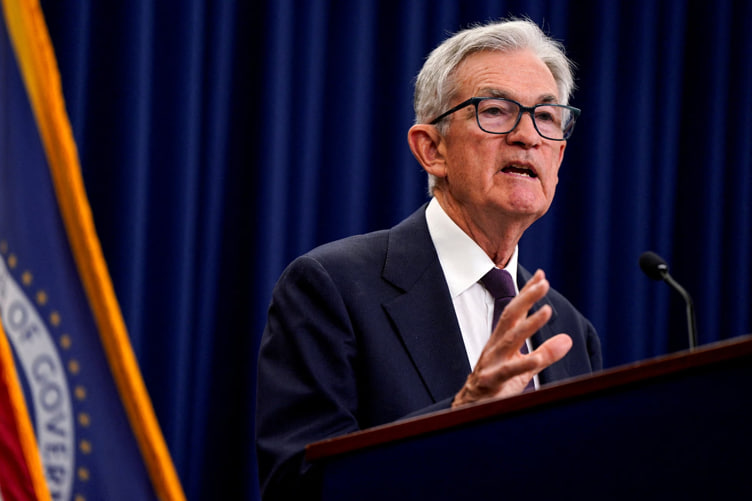
Powell Just Lit the Fuse — Markets Are Heating Up!#Powell just dropped a major signal — the end of QT could be near, and the Fed might start preparing the ground for rate cuts and a potential return of QE. That’s basically the market’s green light for more liquidity and a softer monetary stance.
Here’s the thing: if the Fed stops quantitative tightening, it means they’ll stop draining liquidity from the system — a move that typically boosts risk assets like stocks, $GOLD , and #Crypto. Combine that with the growing expectation of rate cuts in October or November, and we’re looking at the start of a possible easing cycle.
Markets are already reacting:
 $BTC and $ETH are both up, and risk sentiment across the board is improving. Investors are betting that cheaper borrowing costs will attract new capital inflows, pushing valuations higher. But there’s also a catch — if inflation flares up again, Powell could easily reverse course, and that would send shockwaves across every market.
Overall, this shift feels like the beginning of a new phase — one that could push gold and crypto higher in the coming weeks. Still, traders should stay sharp; markets love to overreact when “easy money” returns. What do you think — are we seeing the start of the next major rally or just another short-term relief bounce?
-
$BTC Eyes a New Rally After $116K Pullback!By analyzing the Bitcoin (BTC) chart on the 12-hour timeframe, we can see that after reaching $116,000, the price partially filled the Fair Value Gap (FVG) we were watching and then started a correction.
Currently, BTC is trading around $111,700.
If the price can hold above the $110K support level, we can expect another bullish move toward higher levels.
The next potential upside targets are $113,800, $116,000, $119,600, and $120,800.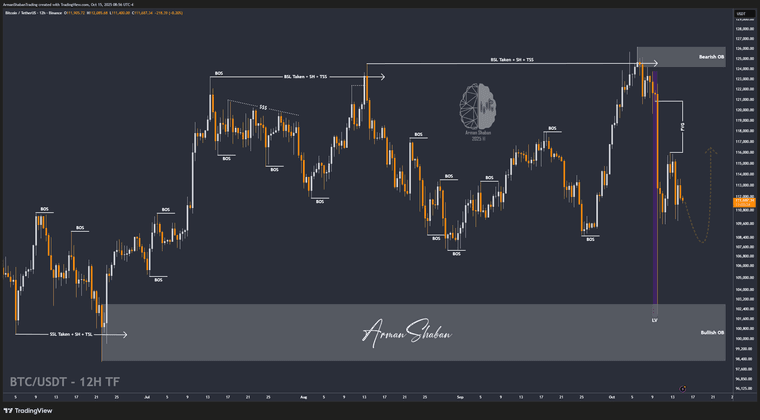
-
$Bitcoin (BTC) Update – Demand Zone Still in Control!By analyzing the #Bitcoin (BTC) chart on the 12-hour timeframe, we can see that after reaching the $116K target, BTC faced a short-term pullback toward $110K, where once again, strong buying pressure emerged from the demand zone. This zone has repeatedly acted as a key defense level, and price has now rebounded to around $113,300, confirming buyers are still in control.
The overall structure remains bullish, and the market continues to respect the previously defined range. As long as BTC stays above $110K, the next upside targets are $118,300, $120,800, and $122,800 — levels that could attract partial profit-taking before another major leg higher.
This reaction shows that institutional demand remains active, absorbing liquidity efficiently from every dip. The Fair Value Gap (FVG) fill process is nearly complete, and Bitcoin could soon prepare for its next impulsive rally if momentum strengthens above $116K.
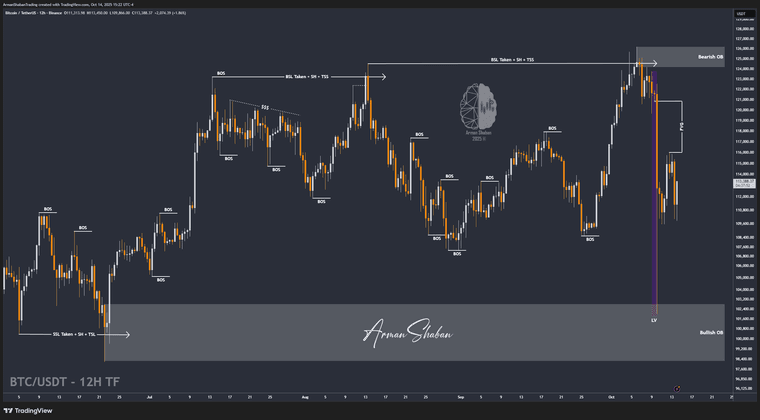
#BTC #Bitcoin #Crypto #ArmanShabanTrading #PriceAction
-
$Ethereum (ETH) Update – Strong Recovery After Sharp Drop!By analyzing the #Ethereum (ETH) chart on the weekly timeframe, we can see that after the recent market dump, ETH sharply dropped to around $3,400, perfectly retesting a major demand zone before bouncing back above $4,100.
This recovery confirms strong buying pressure and shows that bulls are still defending the broader bullish structure.As long as ETH continues to hold above the $3,900–$4,000 support zone, the main outlook remains fully valid. The next upside targets are $4,950, $5,500, and $6,000 — with momentum likely to accelerate once price stabilizes above $4,200.
This move reflects a classic liquidity sweep followed by demand absorption — a healthy correction phase that could fuel Ethereum’s next leg toward new highs.

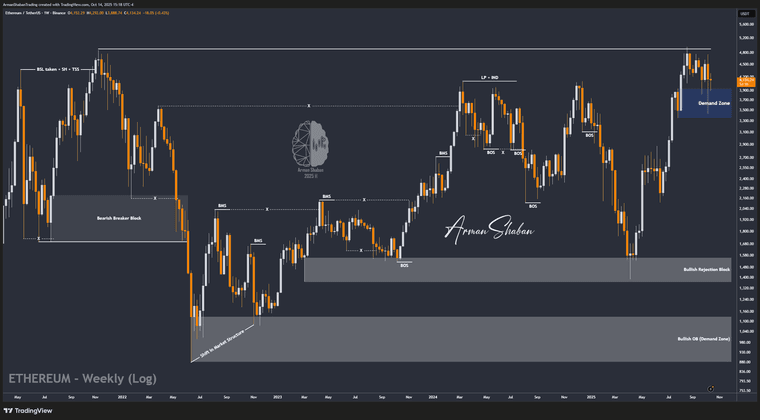
#ETH #Ethereum #Crypto #ArmanShabanTrading #PriceAction