


TONUSDT — 1M Probability Map | 40% Bearish vs 10% Bullish
Trading
3
Posts
3
Posters
10
Views
-
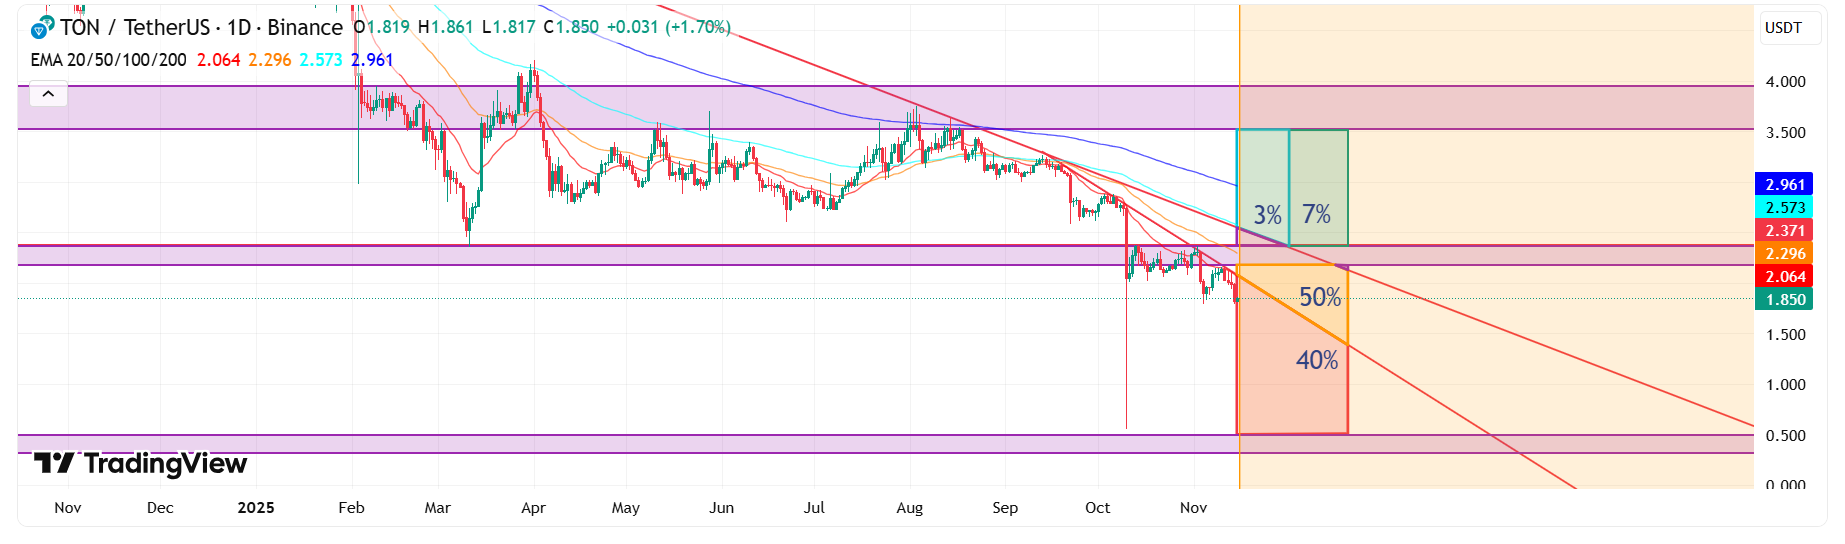 This chart is a probability-based forecast for TONUSDT over the next 30 days — instead of predicting one final direction, I mapped out four possible outcome zones with weighted probabilities based on: Supply & Demand Zones Structural Trend Lines Volume Weakness Failed Breakout Behavior EMA Cluster Resistance Probability Map: 40% → Deep Bearish Continuation Zone 50% → Sideways / Accumulation Zone 3% → Mild Relief Rally 7% → Strong Bullish Breakout Zone This model will be updated if TON breaks structure or volume sentiment shifts.
  Share your scenario in comments — bullish or bearish?
 -
The imbalance is clear — bearish probability is dominating the longer timeframe.

-
Unless volume shifts, the bullish side doesn’t stand much chance here.
 ️
️