


Ethereum Next Buying Move Read the Description
-
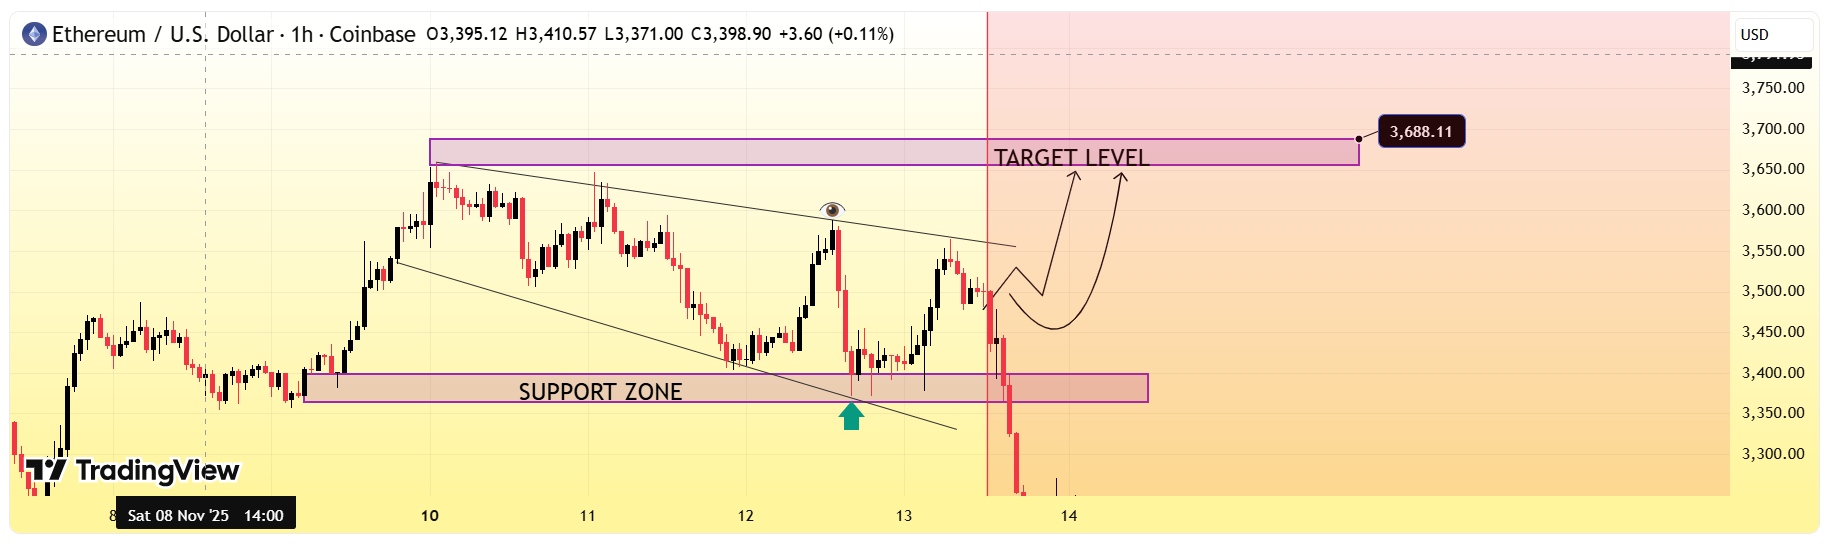 The chart shows Bullish Trend
Support Zone: Around $3,200–$3,300 (clearly marked).
Target Level: Around $3,680–$3,700.
Price has bounced up from the support zone and is now moving toward that target region.
The chart’s drawn projection shows a bullish retracement into the upper zone before a potential pullback.
Short Setup Idea (Counter to the Bullish Move)
If you’re waiting for a short (sell) opportunity, the best area would be near the target resistance zone shown in your chart.
Short Entry Zone:
$3,650–$3,750
(This is the “Target Level” boxConfirmation to Look For
Wait for bearish confirmation before entering:
A rejection candle
Lower time-frame break of structure
Declining volume or momentum divergence on RSI/MACD
-
ETH structure looks ready for a calculated move — timing will be key.

