


Riding the Bands: A Trader’s Guide to the Keltner Channel
-
If you’ve hung around trading forums for more than five minutes, you’ve probably heard someone mention Bollinger Bands. They’re like the rockstars of the “price channel” indicators. But lurking in the background—quieter, cooler, and (some would argue) more elegant—is the Keltner Channel.
So what is it, and why should you care? Let’s dive in.
The Basics: What is the Keltner Channel?
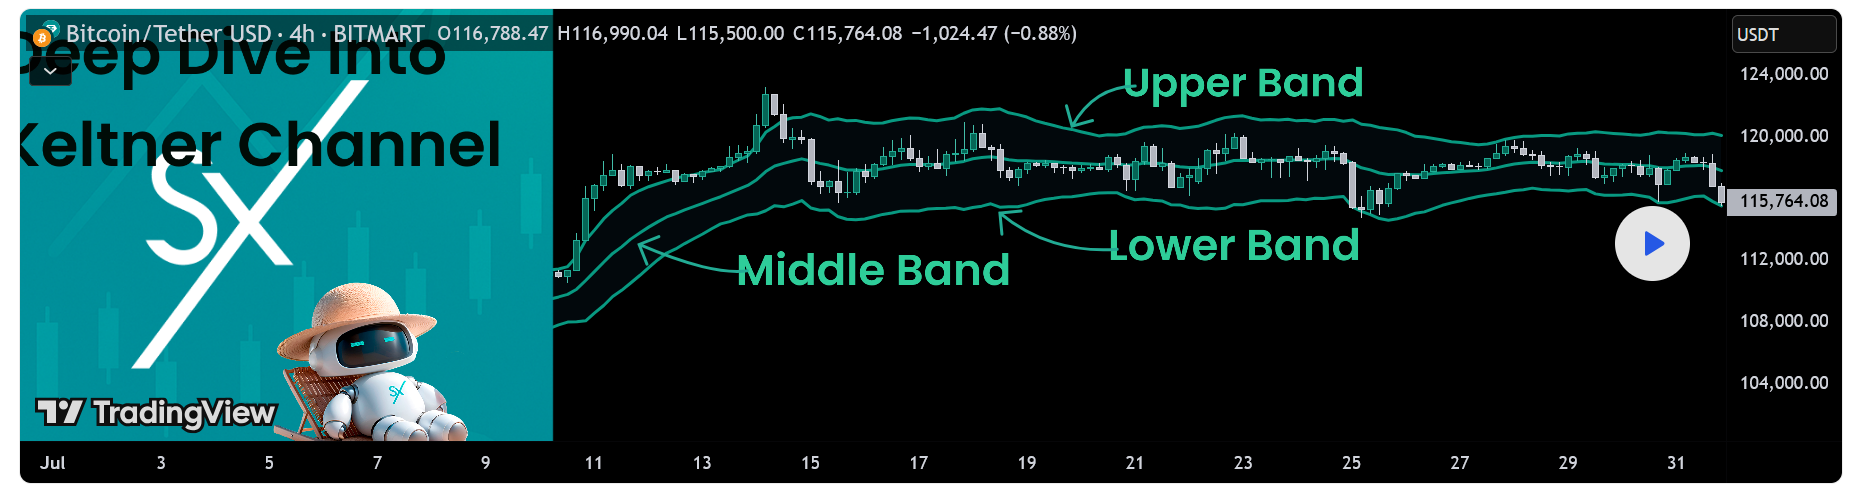
The Keltner Channel (KC) is a volatility-based envelope set around an Exponential Moving Average (EMA). Instead of using standard deviation (like Bollinger Bands), it uses the Average True Range (ATR) to measure volatility.
In simple terms:
Middle Line → EMA (usually 20-period).
Upper Band → EMA + (Multiplier × ATR).
Lower Band → EMA – (Multiplier × ATR).
So if price is bouncing between those bands, the Keltner Channel is basically showing you:
 “Here’s the average price trend, and here’s how far it’s swinging above and below it, based on volatility.”
Why Traders Use It
Trend Identification
If price hugs the upper band, that’s usually a sign of strength (uptrend).
If it clings to the lower band, weakness (downtrend).
If it’s dancing around the middle EMA, you’re probably looking at chop or consolidation.
Breakout Signals
A strong close outside the channel can hint at a breakout.
BUT (and this is important), don’t treat it like gospel—it’s more of a “heads up” than a magic 8-ball.
Overbought / Oversold Zones
Similar to Bollinger, but KC tends to be smoother and less reactive to price spikes.
Some traders prefer this because it cuts down on the “false alarms.”
Keltner vs. Bollinger: The Family Feud
Bollinger Bands expand/contract wildly with sudden volatility. They’re like that one cousin who drinks too much coffee—jittery and loud.
Keltner Channels are calmer, ATR-based, and provide a steadier framework. Think of them as the Zen cousin who practices yoga.
Some traders even use both:
When Bollinger Bands push outside Keltner Channels, it can indicate an impending volatility explosion (sometimes called the squeeze strategy).
How Traders Actually Use It (Without Going Crazy)
Trend Trading: Enter long when price breaks above the upper band in an uptrend, short if it breaks below in a downtrend.
Trailing Stops: Use the opposite band as a dynamic stop-loss level.
Filters: Combine with RSI or MACD so you’re not relying solely on channels (because no indicator is a silver bullet).
A Quick Reality Check
No indicator—Keltner, Bollinger, or otherwise—will hand you easy money. They’re tools, not fortune tellers. The KC is best used as part of a system, not in isolation.
As the saying goes: “Indicators don’t predict, they react.”
Final Thoughts
The Keltner Channel is like a more chill cousin of Bollinger Bands—less flashy, but highly effective in smoothing volatility and showing trend structure. Whether you’re day trading, swing trading, or just geeking out over charts at 2 a.m. (we’ve all been there), KC deserves a spot in your toolbox.
So next time you’re setting up your charts, maybe give the Keltner Channel a chance. Who knows? It might become your new favorite trend wingman.