


The Golden Pocket: Fibonacci’s Sweet Spot in Trading
-
Hello, traders!
If the crypto market had a VIP lounge, the golden pocket would have a permanent reservation. It’s that elusive, almost mystical zone in the Fibonacci retracement where price often decides its fate. Will it make a heroic comeback… or lose steam entirely? Before we dive in, one thing needs to be crystal clear: the golden pocket in trading is not a magic wand. On its own, it’s just a mathematical range. Used without confirmation from other indicators, volume analysis, or broader market context, it can lead you straight into a trap. Professional traders and algorithms treat it as one tool in a much BIGGER TOOLBOX.
What Is the Golden Pocket in Trading?
In technical terms, the golden pocket refers to a specific slice of the Fibonacci retracement scale, typically between 61.8% and 65%. These numbers aren’t random. The 61.8% figure comes from the Fibonacci sequence, a ratio found in nature’s architecture — spirals of seashells, galaxies, flower petals — and eerily echoed in financial markets. The small range between 61.8% and 65% is what traders call the Fibonacci golden pocket or golden pocket fib levels.
Here’s the logic: when an asset trends up but starts to pull back, it often retraces a portion of that move before continuing. The fib retracement golden pocket tends to be the last meaningful zone where buyers step in before momentum breaks completely. In a downtrend, it works the same way but inverted — the price rallying into the golden pocket often finds sellers ready to push it back down.
Why does it matter? Market behavior is, in part, a reflection of human psychology. Many traders — from retail to institutions — watch these levels, which makes reactions here more probable. Add in algorithms coded to act at certain Fibonacci ratios, and you have a cluster of activity that can turn the golden pocket into a genuine battleground.
But, and here’s that warning again, a retracement into the golden pocket alone doesn’t guarantee a reversal. Without confluence from other tools (trendlines, moving averages, volume spikes, momentum oscillators), it’s simply a potential reaction zone.
Why the Golden Pocket Works (Sometimes)
The golden pocket trading concept thrives on repetition. Over years of chart history across markets — stocks, forex, crypto — this small Fibonacci zone has been tested again and again. It often coincides with areas of previous support/resistance or with liquidity zones where large orders are waiting.
Think of it like this: if price is a runner and the market is a racetrack, the golden pocket is the point where the runner slows down to decide whether to push for another lap or leave the track. Sometimes they sprint ahead, sometimes they collapse, but the decision often happens there.
In crypto, this zone is particularly watched because of the market’s volatility. Bitcoin, Ethereum, and other majors have shown countless reactions here, which keeps the cycle going. Traders believe in it because it’s worked before, and because traders believe in it, it works again… until it doesn’t. That’s the critical point. IT DOESN’T ALWAYS WORK. Treating it as gospel is one of the fastest ways to get stopped out. Smart traders always ask: What else confirms this zone?
A Real Bitcoin Example
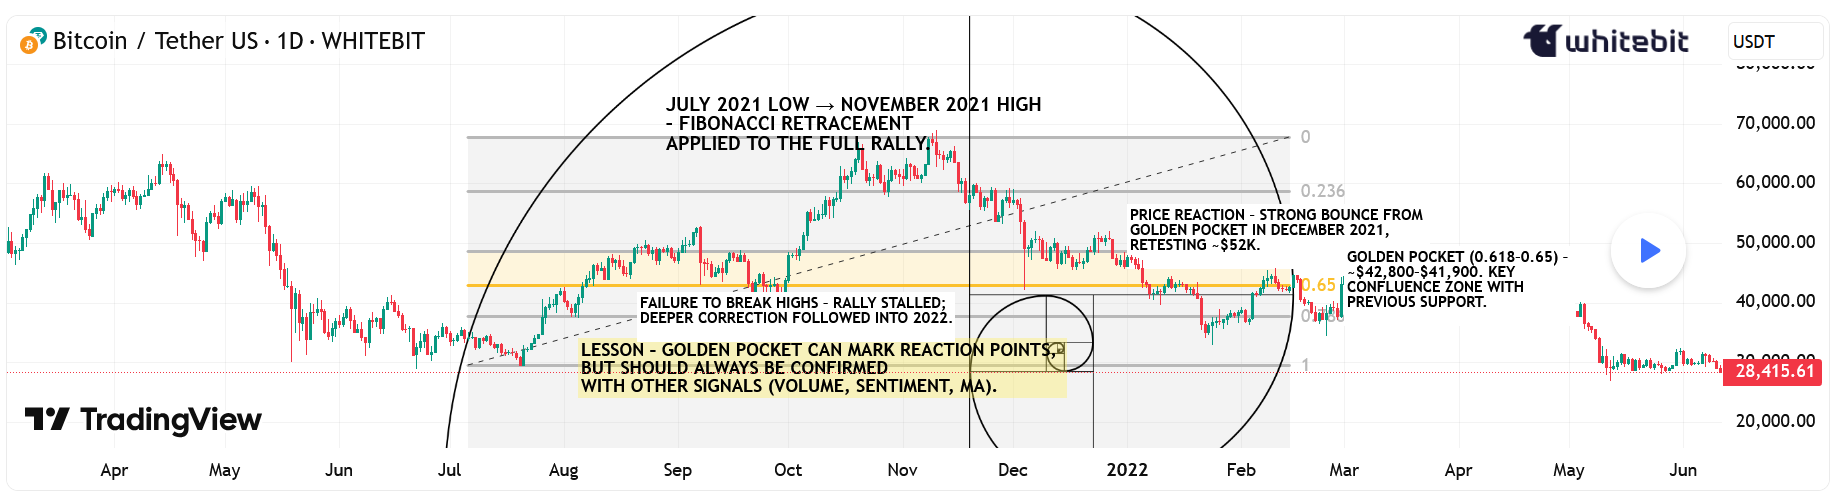
Let’s jump back to September 2021. Bitcoin had rallied from its July swing low around $29,000 to the early September high near $52,900. Then, a correction began.
If you plotted a Fibonacci retracement from that July low to the September high, the pullback landed almost perfectly in the golden pocket range between $42,800 and $41,900. On the chart, this wasn’t just a random number zone — it aligned with a previous area of consolidation and a visible liquidity shelf.
The market reaction? Price respected the zone, paused for a few sessions, then bounced to retest the $52K area. However, here’s the twist — it didn’t break new highs. By November, the rally failed, and BTC entered a deeper correction.
That single example tells you everything you need to know: the golden pocket can be a reaction point, but not a guaranteed trend reversal. Those who combined it with volume divergence, macro sentiment, and moving averages saw the warning signs early. Those who didn’t… learned a painful lesson.
The Takeaway
The golden pocket fibonacci is one of those charting concepts that sticks in traders’ minds because it’s both elegant and, at times, eerily accurate. It’s a reflection of how price action can mirror natural ratios found in the world around us.
But markets are not bound by mathematics alone — they’re driven by liquidity, sentiment, and macroeconomic forces. The golden pocket in trading works best when it’s part of a confluence: combine it with other technical indicators, volume profile analysis, or key horizontal levels.
On its own? It’s just a pretty number. In the right hands, with the right supporting evidence, it’s a zone where history has shown the market likes to make decisions.