


Circle buying opportunity. Bullish chart
-
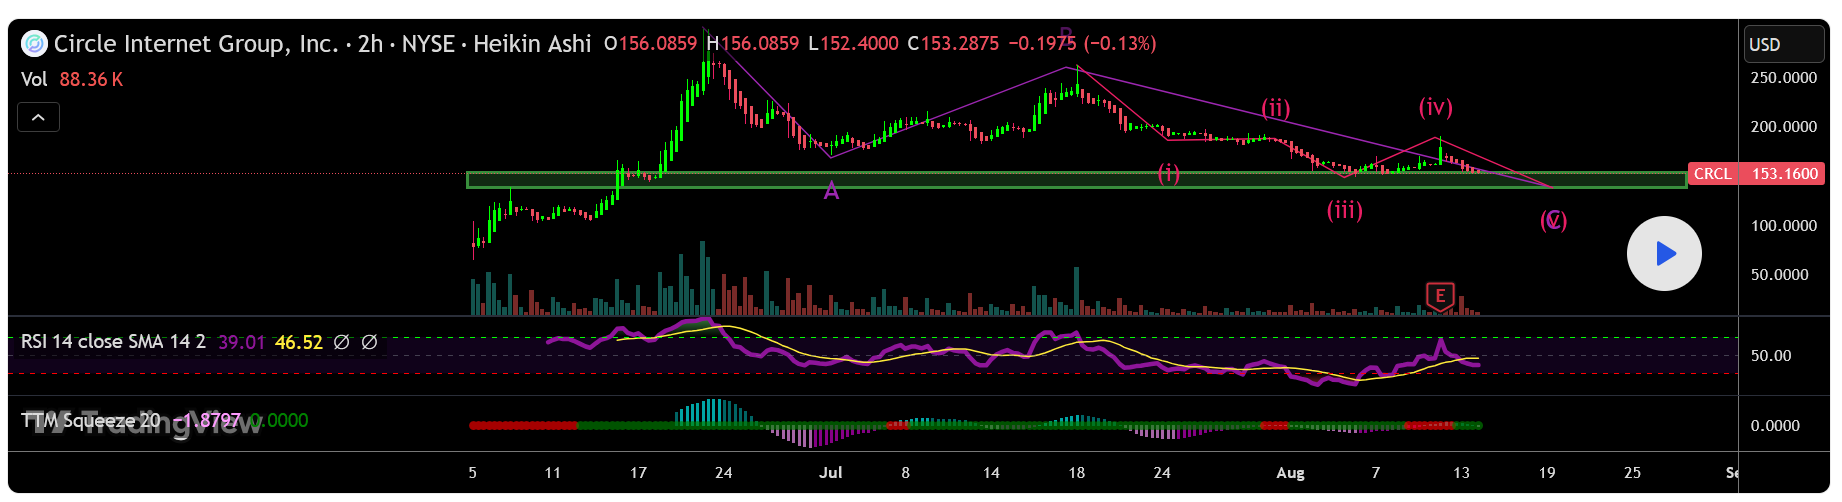
With the announcement of the new stock release, more selling should come. I see limit entries of 139 and 144 to be ideal. Overall pattern is 4th wave correction IMO. Target at least double top in short term and much higher long term. People smarter than me would put stop losses under those targets, but I'm a degen. Any accumulation in the green box should be good. -
Interesting take — the 4th wave correction theory fits if we’re still following Elliott Wave principles, but I’d be cautious on the “any accumulation in the green box” call. With the new stock release adding selling pressure, liquidity gaps can form quickly. If momentum fails to reclaim above 144 after a dip, the next support might be much lower. Still, your double-top short-term target makes sense if volume spikes on a bounce. It’s all about position sizing and risk control here — even for the “degens.”
-
I like that you’ve set clear limit entries at 139 and 144. In volatile setups like this, defined entry zones are everything. That said, 4th wave corrections can be deceptive — they sometimes extend longer than traders expect before breaking out. If we do get that push to a double top, scaling out along the way might lock in gains while still letting you ride the “much higher” long-term target. For anyone following, stops under those zones aren’t about fear — they’re about keeping capital ready for the next setup.