


How to Read COT Data: Understanding Big Players’ Order Flow
-
 My COT Approach — Reading the Big Players’ Moves
Hey traders,
Today I’m breaking down my personal approach to using Commitment of Traders (COT) data to find higher-timeframe bias. If you want to trade with the real market momentum (a.k.a. what the big players are doing) rather than chasing noise, this is for you.There are many ways to use COT data — Larry Williams, Anton Kreil, and others each have their own twist.
This is the method that works for me. It might work for you too.
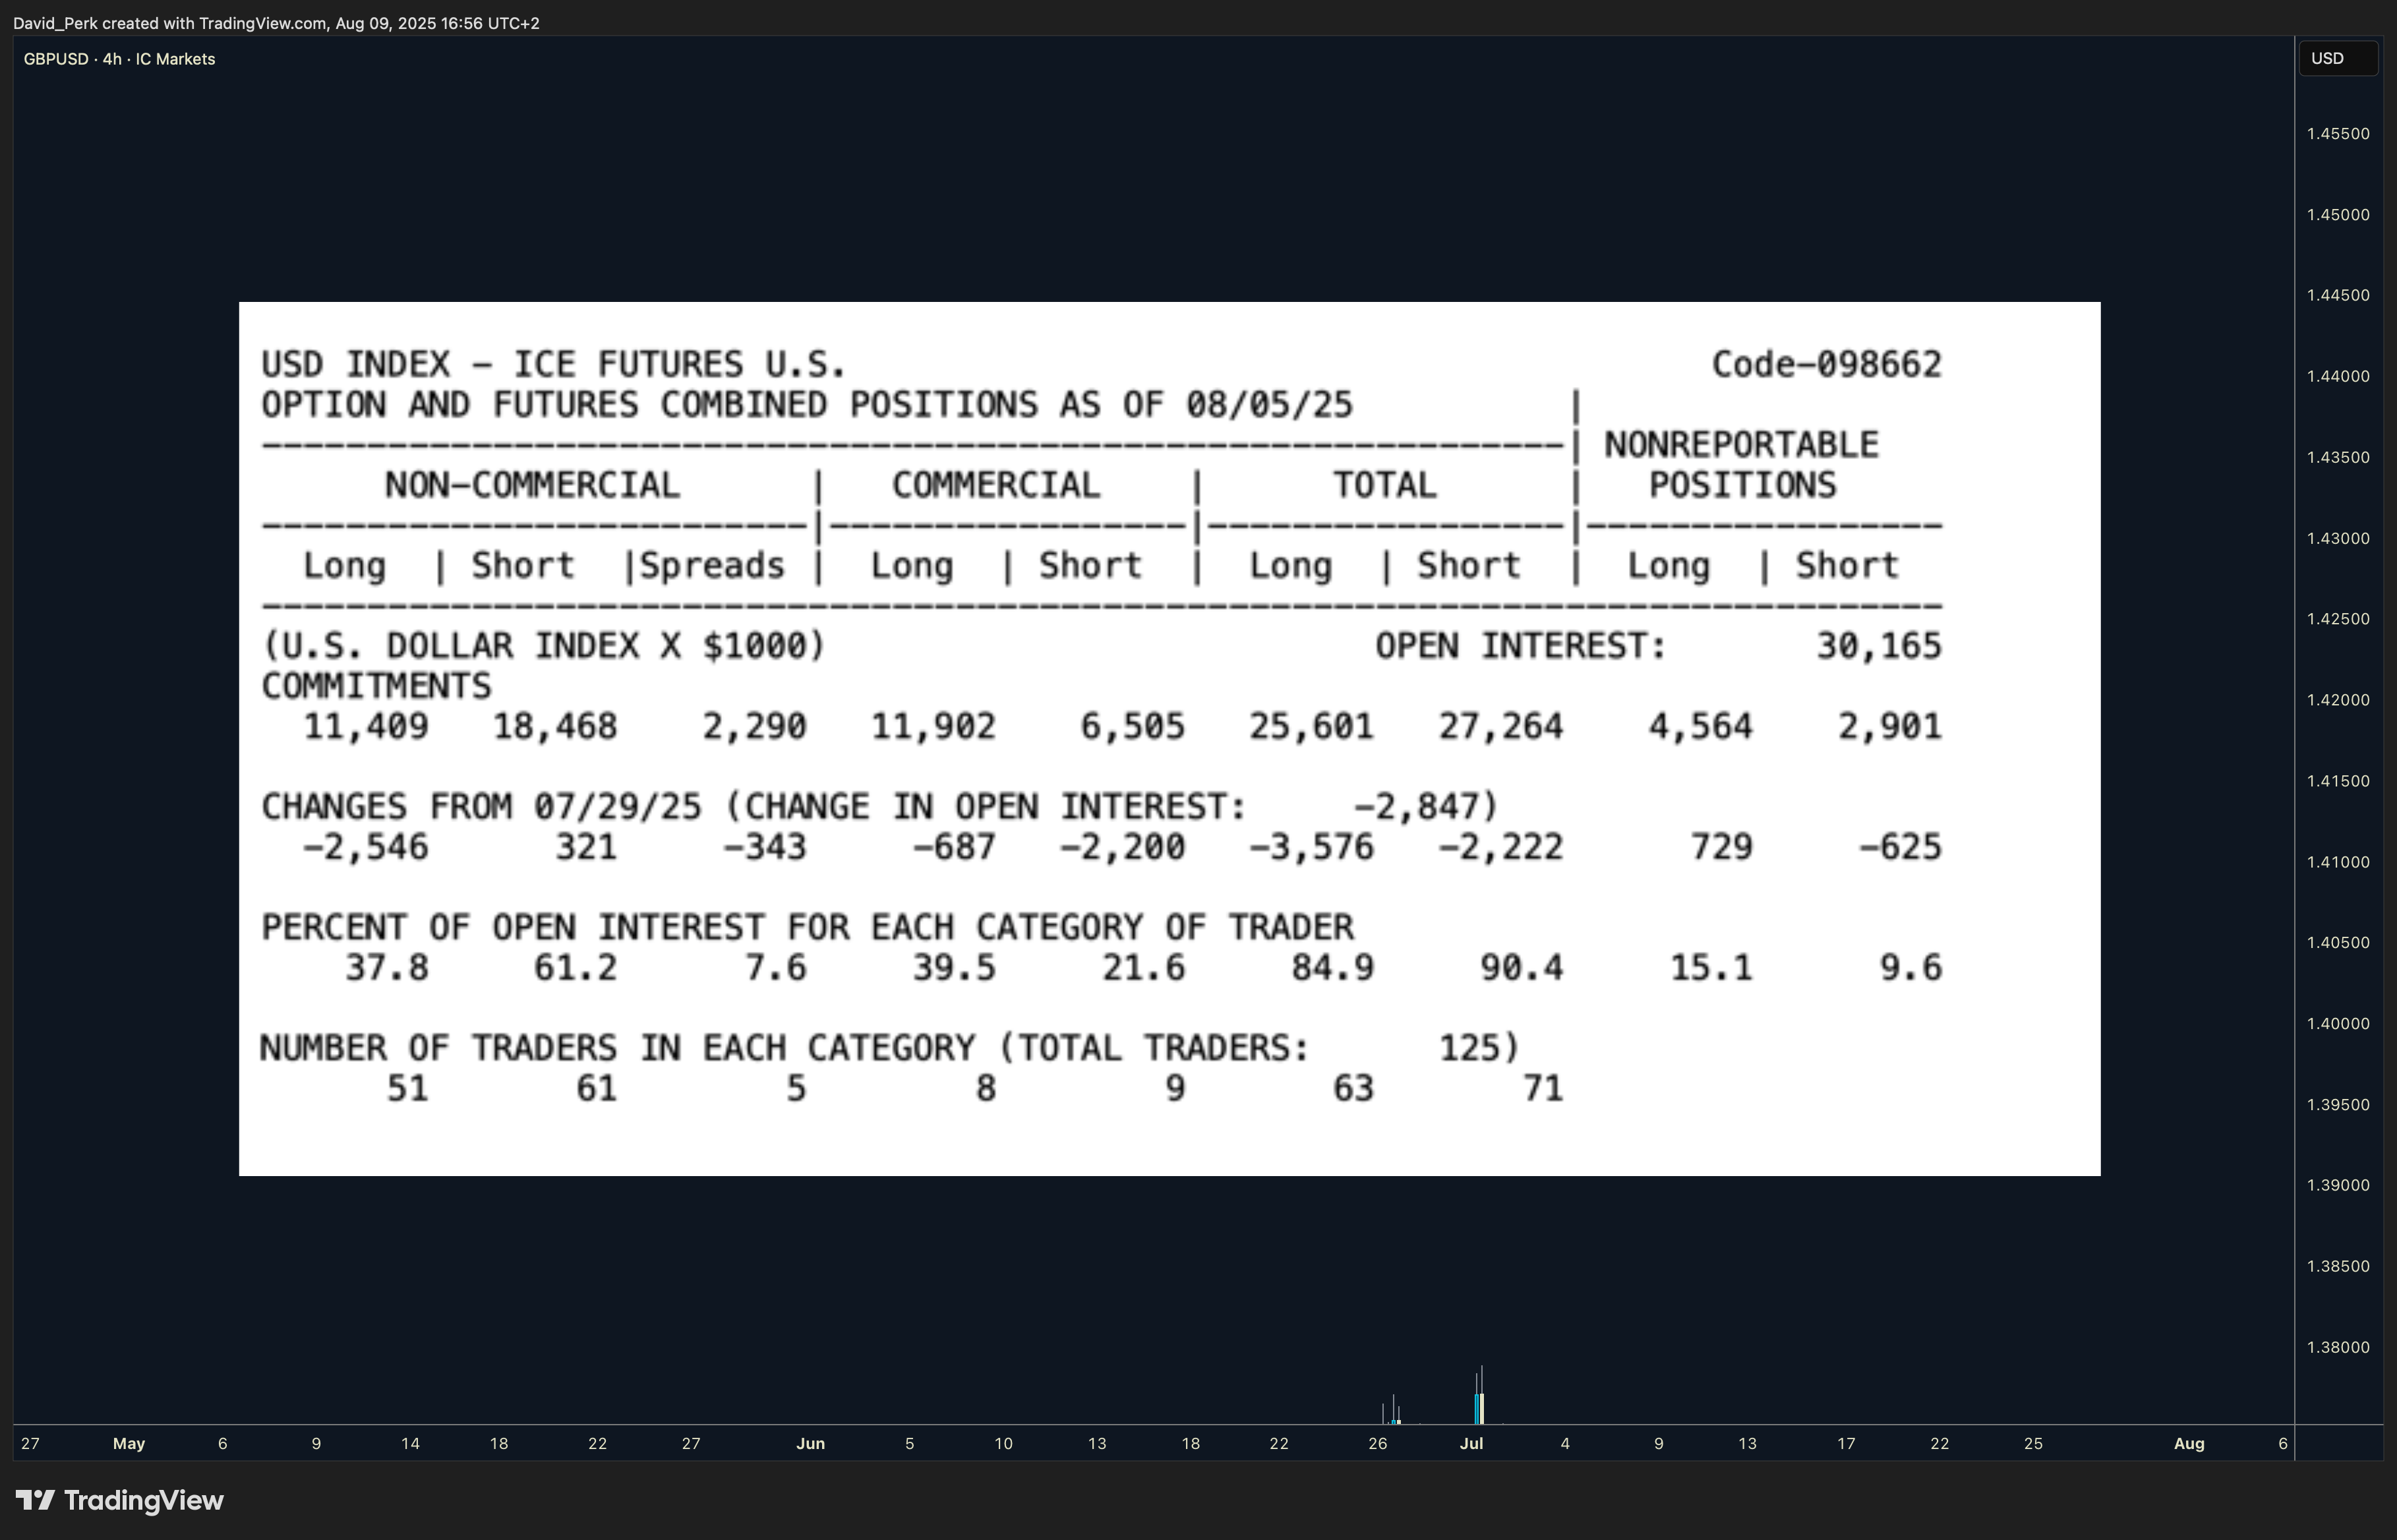
 What Is COT Data?
The Commitment of Traders report is published every Friday by the CFTC.
It shows the open futures positions of different market participants as of the previous Tuesday.It’s basically a peek into institutional positioning — minus high-frequency and market-making noise.
The catch:
Data is delayed (Tuesday’s data is released Friday).

We miss the last 3 days of moves.
But don’t worry — I’ll show you how to read between the lines.
 Why Use COT?
COT can help you:
Understand higher timeframe bias

Spot shifts in institutional positioning

Identify trend continuations or reversals

Avoid retail sentiment traps
It’s not a standalone entry trigger — I use it as a macro confirmation layer for swing or position trades.
The beauty?
Institutions trade based on fundamentals. You don’t have to dig through macro reports — just follow their positioning.
 The Main Market Participants
COT splits traders into several categories:
Commercials (Hedgers)

    Producers, manufacturers, big institutions locking in prices.

    Usually contrarian at extremes (record net long/short often signals reversals).

Non-Commercials (Speculators)

    Hedge funds & large speculators.

    Follow trends, represent “big money” sentiment.

Dealers

    Big banks facilitating trades.

    Take the other side of speculative flows.

Leveraged Money

    Hedge funds using high leverage.

    Positions show short-term speculative sentiment.
Who I follow: Non-Commercials (Speculators).
Larry Williams focuses on Commercials, Anton Kreil prefers Leveraged Money — try and see what works for you.
 Which Report?
I use:
 Traders in Financial Futures (TFF) — covers forex, bonds, and indexes.
Where to find:
Free on the CFTC site — but the standard week-to-week format isn’t enough.
Institutions don’t flip positions overnight — I track larger data samples.
My Tracking MethodI collect data weekly into columns, tracking:
Long % exposure

Short % exposure

Net positions

13-week averages

Historical highs/lows
The relationships between these numbers give me insight into:
What’s really driving price action

Strong levels worth watching

Order flow patterns
Common COT Patterns
- Bullish Pattern – Longs Growing / Shorts Closing
Strongest signal — clean institutional buying.
Example: EURUSD — steady long growth, rapid short closing → confirmed bullish trend.
2. Weak Currency – Longs Growing / Shorts ClosingExample: USDJPY — looks messy, but numbers show weak JPY as shorts are closed and longs added.
3. Bearish Consolidation – Shorts BuildingExample: AUDUSD — tight consolidation, longs flat, heavy short building → big drop incoming.
4. Profit-Taking MovePrice spikes above highs, but longs close instead of adding.
Example: Gold — overheating market, no heavy shorting yet → expect pullback or consolidation.
5. Sharp Position Drop Without Opposite BuildingExample: USDCHF — big long reduction starts sell-off without major shorting. Weekly data alone would miss this.
 ️ Important Note on Short-Term Price Action
Even if COT shows a bearish bias, price can still rally short-term (2–3 weeks).
Big players often add shorts above highs, not at lows — use price action for entries.That’s the overview of how I use COT to stay aligned with the market’s heavy hitters.
Next, I’ll share how I combine this with chart context to pinpoint high-probability swing setups. -
This is one of the most practical explanations of COT usage I’ve seen on here. I really like how you focus on Non-Commercials rather than trying to mix all categories at once. Too many traders just glance at a single weekly report and think they’ve found the holy grail, but your method of tracking 13-week averages and historical highs/lows gives a much deeper read on positioning trends.
Also agree 100% on the “delayed data” point — a lot of people dismiss COT because it’s 3 days old, but the reality is, the big players you’re tracking aren’t flipping bias every 48 hours. Those positions often represent core macro plays that unfold over months, and catching the directional intent is way more important than being exact to the day. -
What stands out here is the pattern recognition framework you’ve built. The distinction between “Bullish Pattern – Longs Growing / Shorts Closing” vs. “Profit-Taking Move” is something most traders miss, and it’s why many end up buying into tops just as institutions are scaling out.
I also appreciate that you acknowledged COT isn’t an entry trigger but a bias filter — combining it with chart structure and price action is exactly how you avoid getting chopped up in countertrend rallies. The example with Gold is spot on: without tracking position changes, retail often sees a breakout, but COT quietly reveals it’s just a liquidation spike.
This kind of systematic approach to sentiment data is gold (pun intended). Would be great to see a follow-up post showing how you merge these insights with actual chart zones for swing setups.