


SOL/USD 2H chart PATTERN.
-
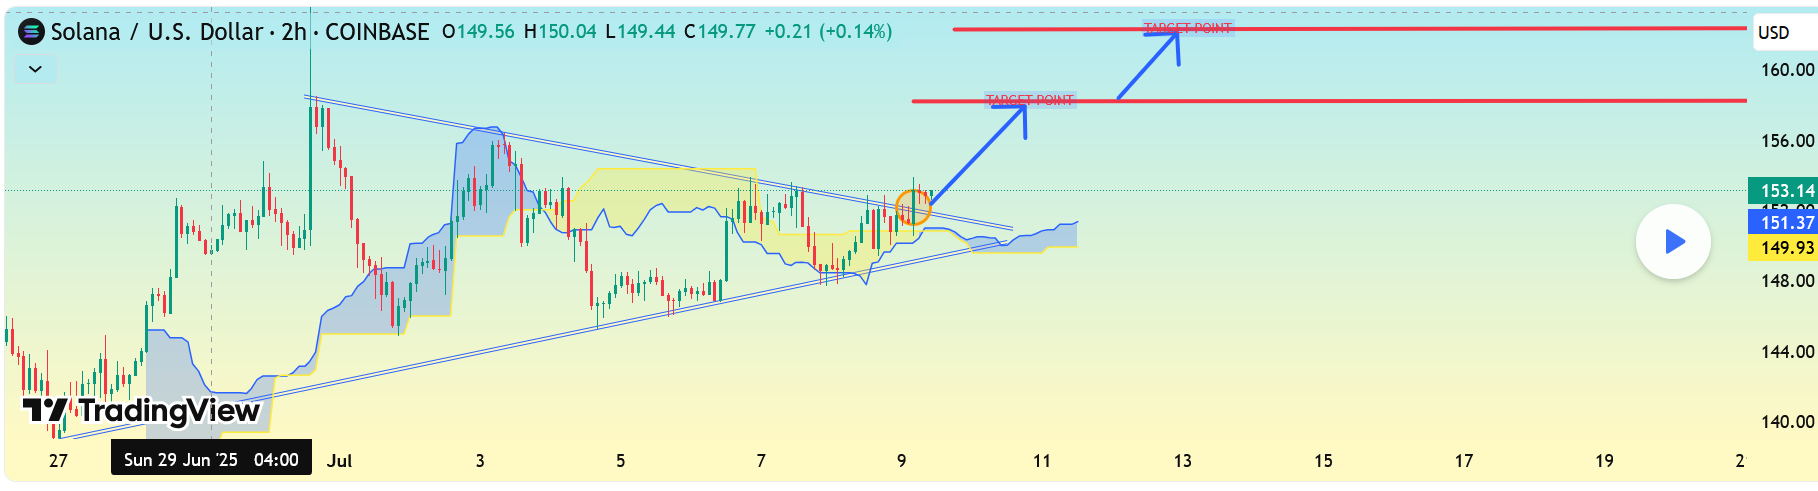
SOL/USD 2H chart, the price is forming a bullish ascending triangle breakout, and it's approaching the upper resistance trendline. If it breaks out with volume, a strong move upward is expected. Bullish Target Points:
-
First Target:
 $157.80 — This is the first horizontal resistance and initial breakout target.
 -
Second Target:
$162.00 — A higher resistance level based on previous highs and projected breakout momentum.
 Additional Notes:
Support Level: Around $149.90 — also near the ascending trendline.
A confirmed breakout above the triangle with a daily candle close and strong volume would validate these targets.
Consider using a stop-loss below $149.00 if you're trading this setup.
Let me know if you want a trade entry suggestion or risk management strategy.
-