Skip to content
  • Categories
  • Recent
  • Tags
  • Popular
  • World
  • Users
  • Groups
Collapse
Brand Logo
UDS UDS: $1.87
24h: 11.10%
Trade UDS
Gate.io
Gate.io
UDS / USDT
MEXC
MEXC
UDS / USDT
WEEX
WEEX
UDS / USDT
COINSTORE
COINSTORE
UDS / USDT
Biconomy.com
Biconomy.com
UDS / USDT
BingX
BingX
UDS / USDT
XT.COM
XT.COM
UDS / USDT
Uniswap v3
Uniswap v3
UDS / USDT
PancakeSwap v3
PancakeSwap v3
UDS / USDT

Earn up to 50 UDS per post

Post in Forum to earn rewards!

Learn more
UDS Right

Spin your Wheel of Fortune!

Earn or purchase spins to test your luck. Spin the Wheel of Fortune and win amazing prizes!

Spin now
Wheel of Fortune
selector
wheel
Spin

Paired Staking

Stake $UDS
APR icon Earn up to 50% APR
NFT icon Boost earnings with NFTs
Earn icon Play, HODL & earn more
Stake $UDS
Stake $UDS
UDS Left

Buy UDS!

Buy UDS with popular exchanges! Make purchases and claim rewards!

Buy UDS
UDS Right

Post in Forum to earn rewards!

UDS Rewards
Rewards for UDS holders
Rewards for UDS holders (per post)*
  • 100 - 999 UDS: 0.05 UDS
  • 1000 - 2499 UDS: 0.10 UDS
  • 2500 - 4999 UDS: 0.5 UDS
  • 5000 - 9999 UDS: 1.5 UDS
  • 10000 - 24999 UDS: 5 UDS
  • 25000 - 49999 UDS: 10 UDS
  • 50000 - 99 999 UDS: 25 UDS
  • 100 000 UDS or more: 50 UDS
*

Rewards are credited at the end of the day. Limited to 5 payable posts per day, 50 K holders - 3 posts per day, 100K holders - 2 posts per day. Staked UDS gives additional coefficient up to X1.5

  1. Home
  2. Hero Portfolio
  3. Chart Patterns - How to read them like a Pro

Chart Patterns - How to read them like a Pro

Scheduled Pinned Locked Moved Hero Portfolio
1 Posts 1 Posters 5 Views 1 Watching
  • Oldest to Newest
  • Newest to Oldest
  • Most Votes
Reply
  • Reply as topic
This topic has been deleted. Only users with topic management privileges can see it.
  • encryptedE Offline
    encryptedE Offline
    encrypted
    wrote on last edited by
    #1

    Chart patterns are visual formations on price charts that help traders anticipate potential market movements.
    These patterns fall into three main categories: bullish, bearish, and indecisive.


    1. Bullish Chart Patterns

    Bullish patterns often signal that price is likely to move upward.

    1.1 Bull Flag
    0TzcHYka.png

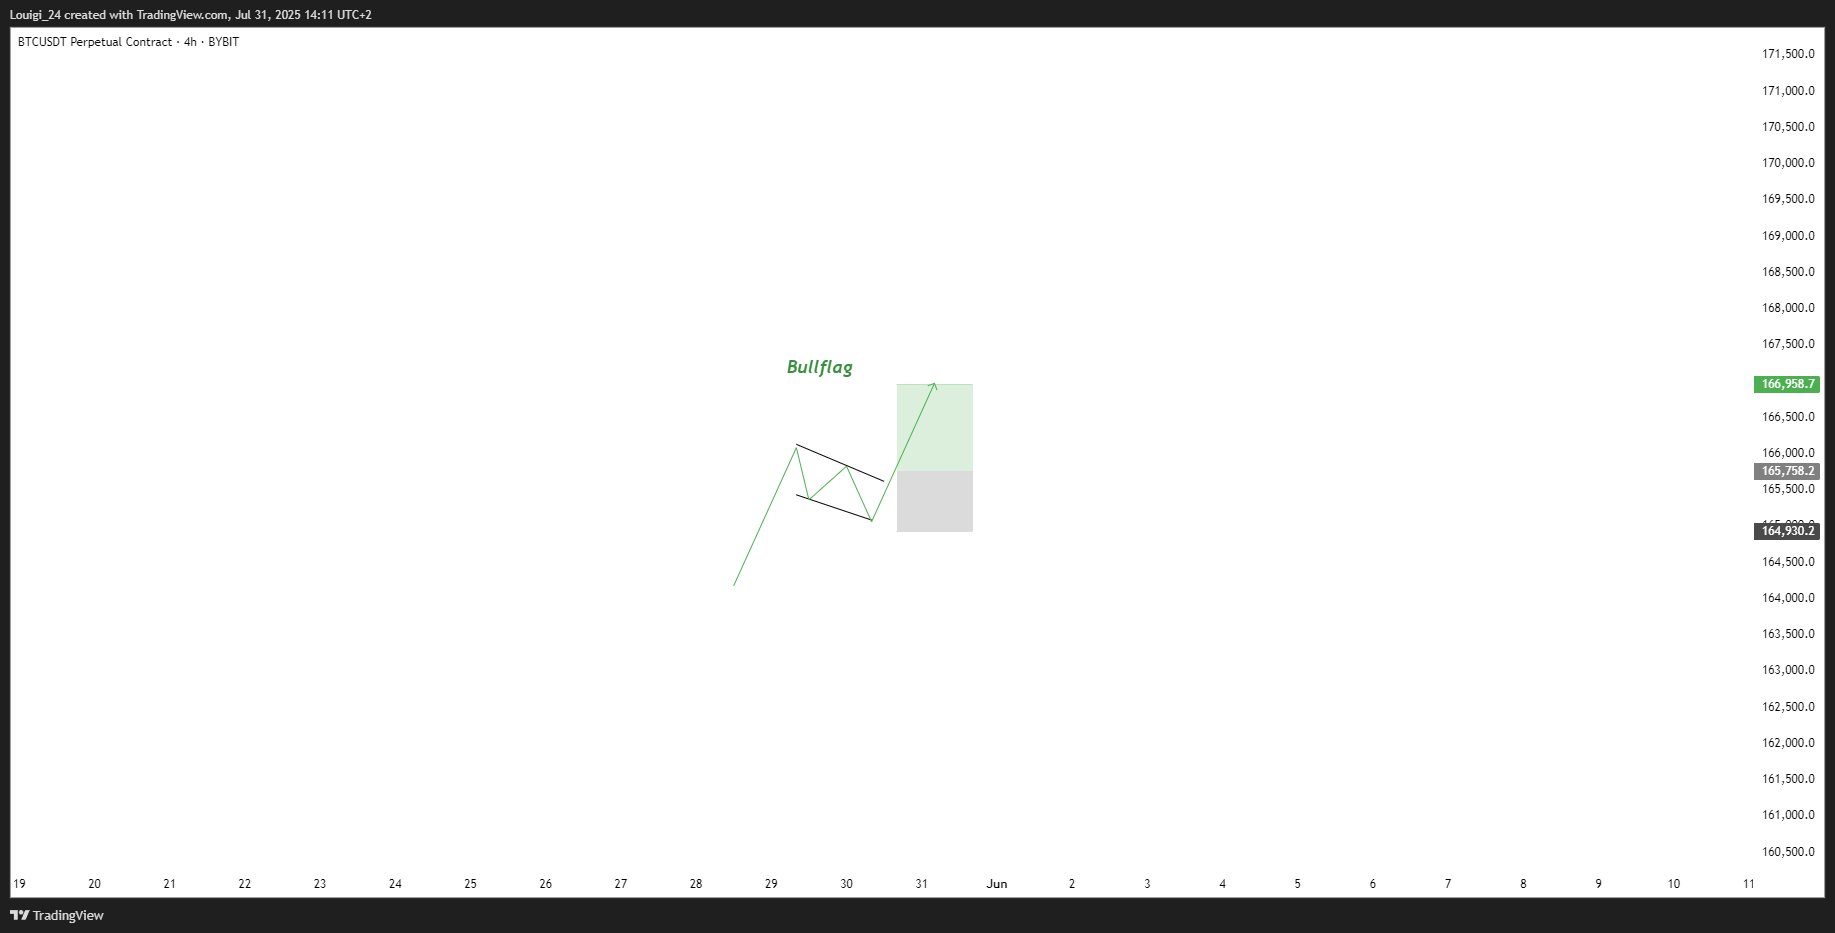
    • What it looks like: A sharp upward move followed by a small downward-sloping rectangle (the flag).
    • Meaning: After a strong rally, the price consolidates briefly before continuing higher.
    • Key insight: A breakout above the flag typically signals a continuation of the trend.

    1.2 Pennant (Bullish)
    yPK1U11v.png

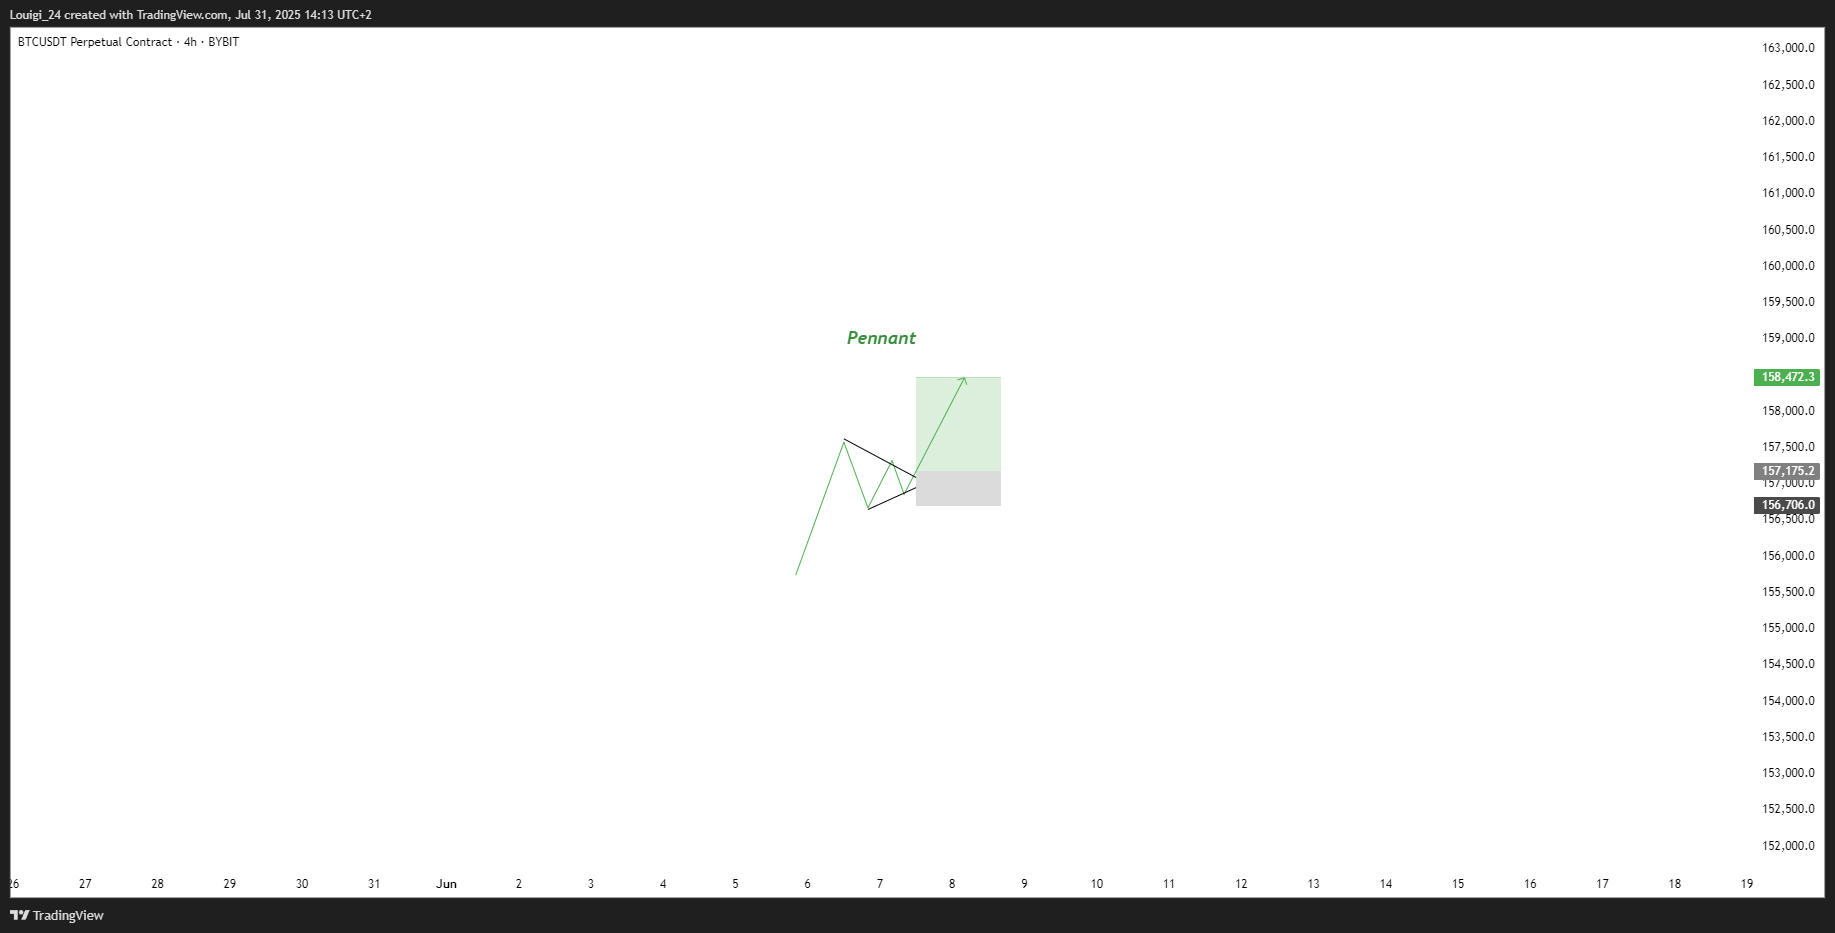
    • What it looks like: A strong upward move followed by a small symmetrical triangle.
    • Meaning: Similar to the bull flag, but the consolidation takes a triangular form.
    • Key insight: Once price breaks above the pennant, the uptrend often resumes.

    1.3 Cup & Handle
    Ry2FUADM.png

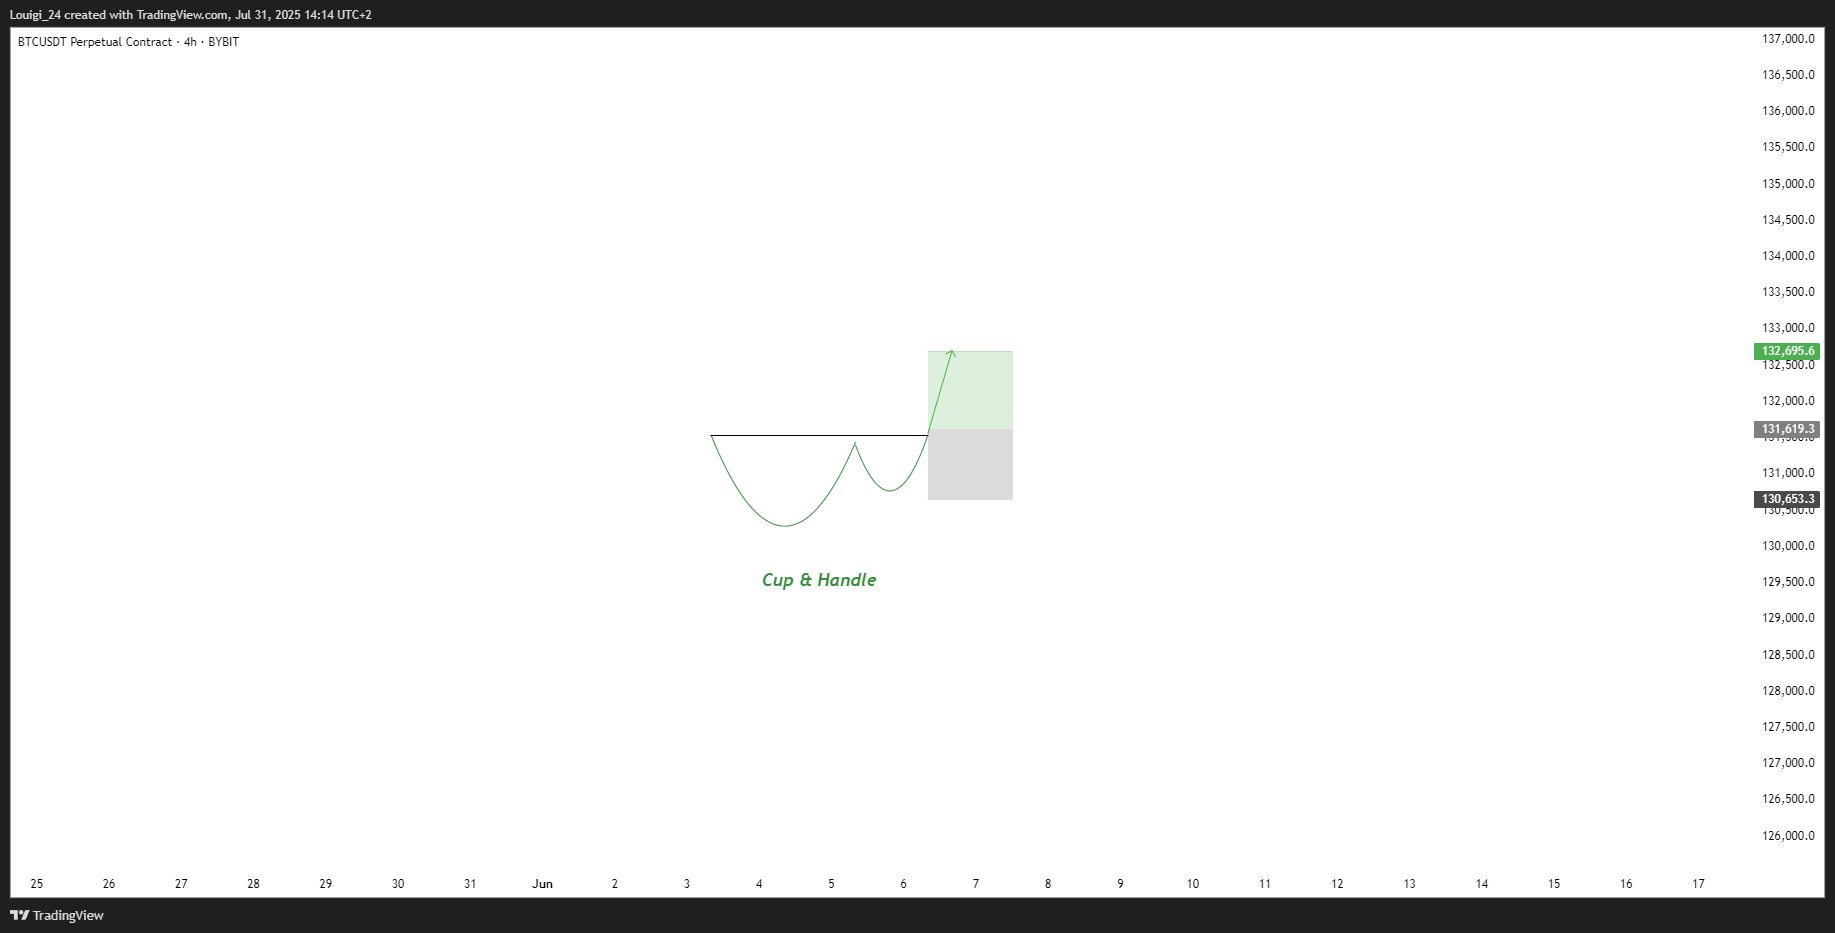
    • What it looks like: A “U”-shaped curve (the cup) followed by a small downward drift (the handle).
    • Meaning: This pattern suggests a period of accumulation before price breaks higher.
    • Key insight: A breakout above the handle signals the beginning of a new bullish leg.

    1.4 Inverse Head & Shoulders
    Nb1kgGtf.png

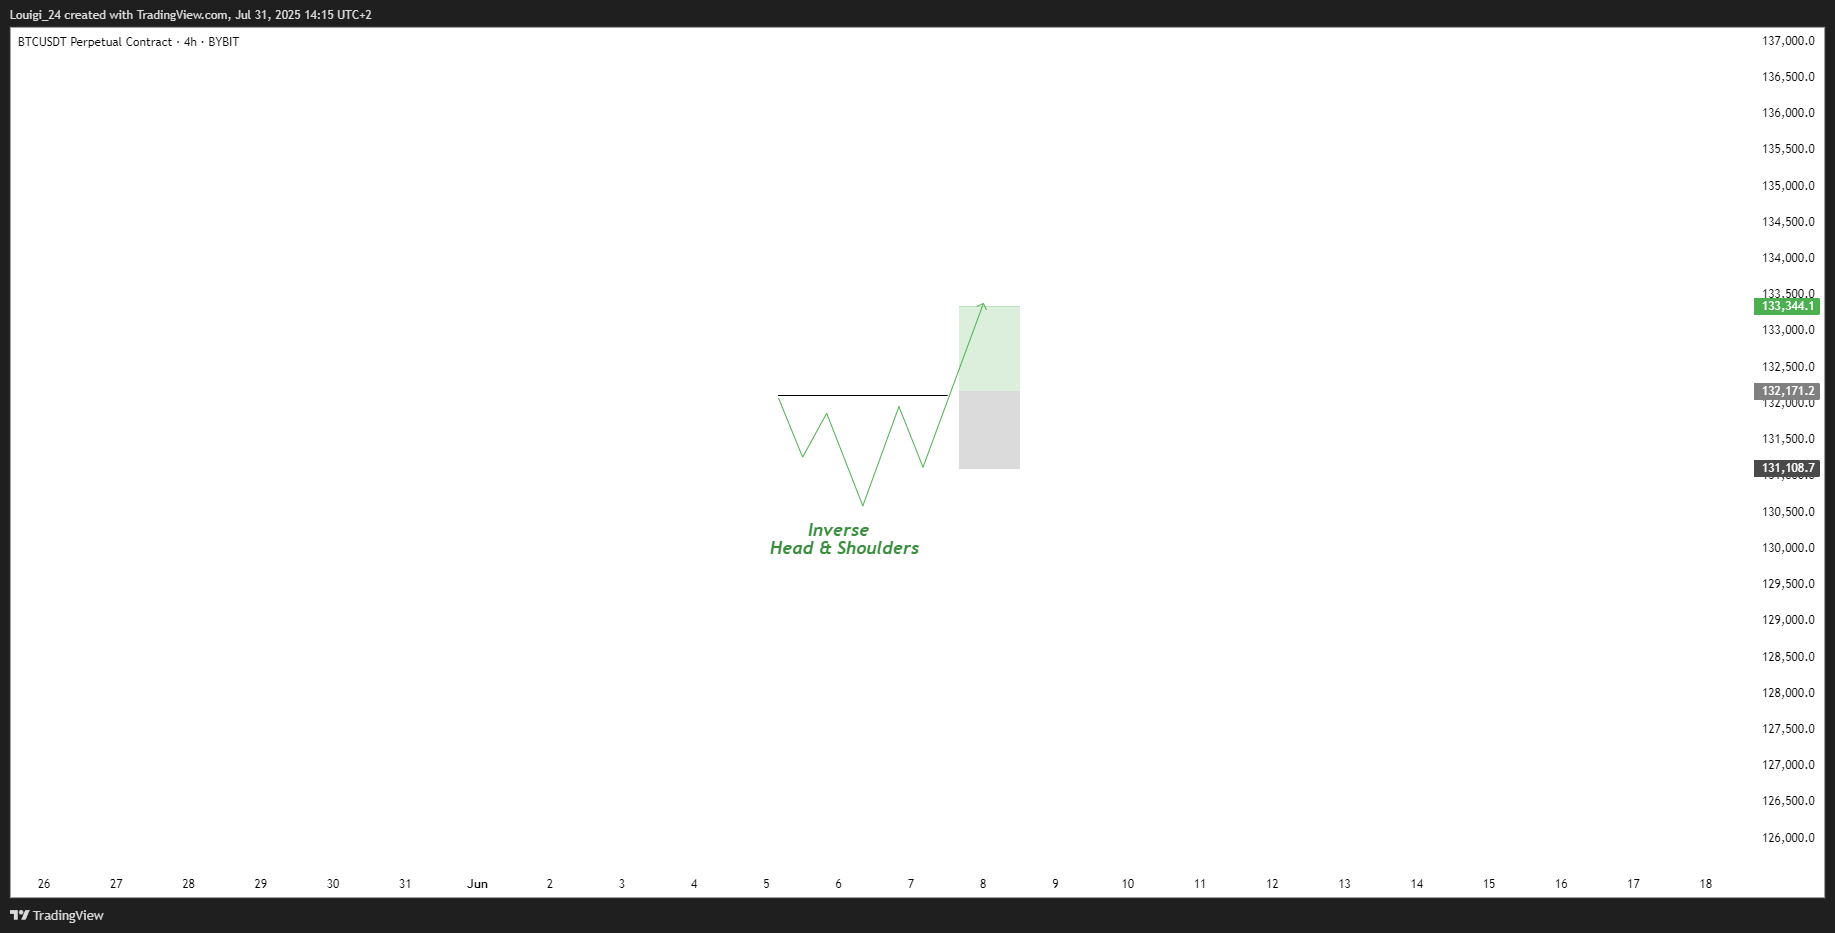
    • What it looks like: Three low points, with the middle low being the deepest.
    • Meaning: This reversal pattern appears after a downtrend and signals a potential change to an uptrend.
    • Key insight: A breakout above the “neckline” confirms the reversal.
    1 Reply Last reply
    0


    Powered by NodeBB Contributors
    • First post
      Last post
    0
    • Categories
    • Recent
    • Tags
    • Popular
    • World
    • Users
    • Groups