


Mastering Buy Side and Sell Side Liquidity - How to trade it!
-
In trading, understanding liquidity is one of the keys to predicting where the market might go next. The Inner Circle Trader (ICT) method teaches traders how to recognize where big players like banks and institutions are likely to enter or exit trades. Two important ideas in ICT trading are buy side liquidity and sell side liquidity. Once you understand what these terms mean and how to spot them on a chart, you can start using them to find better trading opportunities.What will be discussed?
- What is Buy Side Liquidity?
- What is Sell Side Liquidity?
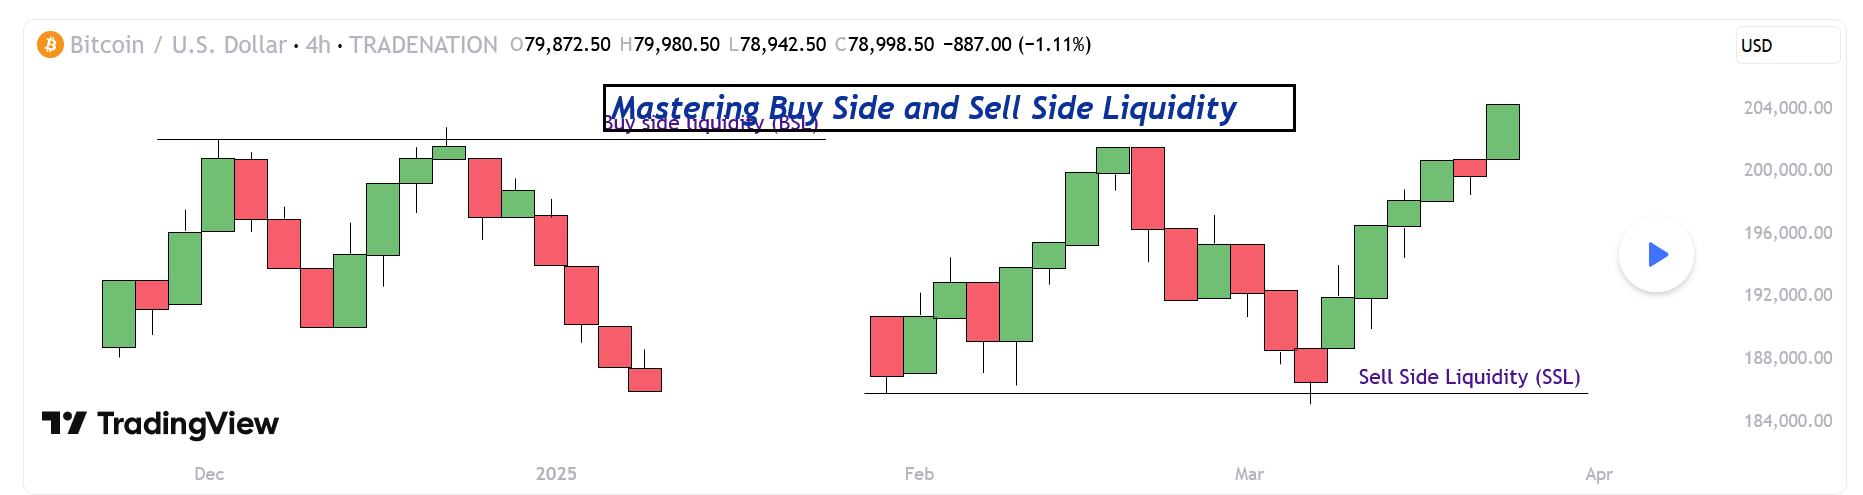
- How do you see Buy and Sell Side Liquidity?
- Examples
- How to trade BSL and SLL Liquidity?
What is Buy Side Liquidity
Buy side liquidity is found above market highs. It refers to all the stop loss orders from people who are holding short positions. When the market is going down, some traders sell (or go short) and place their stop losses above recent highs to protect themselves. These stop losses are actually buy orders because closing a short position requires buying. Big institutions know this, so they push price upward to trigger those stop losses and grab that liquidity. That’s why you’ll often see the market spike above a recent high before reversing. That spike is the market grabbing buy side liquidity.What is Sell Side Liquidity
Sell side liquidity is the opposite. It’s found below recent lows. This is where traders who are buying (going long) place their stop losses. If someone buys a market, they’ll usually put a stop loss just below a previous low. That stop loss is a sell order. Smart money looks at these areas as pools of sell side liquidity. So when the market moves down quickly and breaks a recent low, it’s likely collecting those sell stop orders. After that, you’ll often see a reversal because the liquidity has been taken.How do you see Buy and Sell Side Liquidity?
You can spot buy side and sell side liquidity by looking at the chart and identifying recent highs and lows where many traders might have placed stop losses. These are usually obvious swing highs and swing lows. If you look at a chart and see a clean high where price previously reversed, that’s likely where traders are placing stops. That makes it a target for buy side liquidity. Same for a recent low, if it’s a clean level where people might have bought in the past, that low probably holds sell side liquidity. The more obvious the level looks, the more likely it’s full of stops and therefore a liquidity target. -
This is a solid breakdown of how liquidity really drives price. Understanding buy-side vs sell-side liquidity is essential if you're trading based on smart money concepts. Institutions hunt liquidity—they don’t just react to it.For example, buy-side liquidity = stop-loss clusters above resistance → perfect place for liquidity grabs before a reversal. Same on the sell-side under support. If you're still only looking at indicators, you're missing half the game.
-
Great topic—this is the kind of info that separates traders from gamblers. When price moves fast, it’s often reacting to where liquidity is resting, not just support/resistance zones.I started improving once I asked: ‘Who needs to buy or sell here, and who’s getting trapped?’ That mindset shift alone helped me spot fake breakouts and sniper entries.