


Ethereum Pullback Explained — What’s Next for ETHUSDT?
-
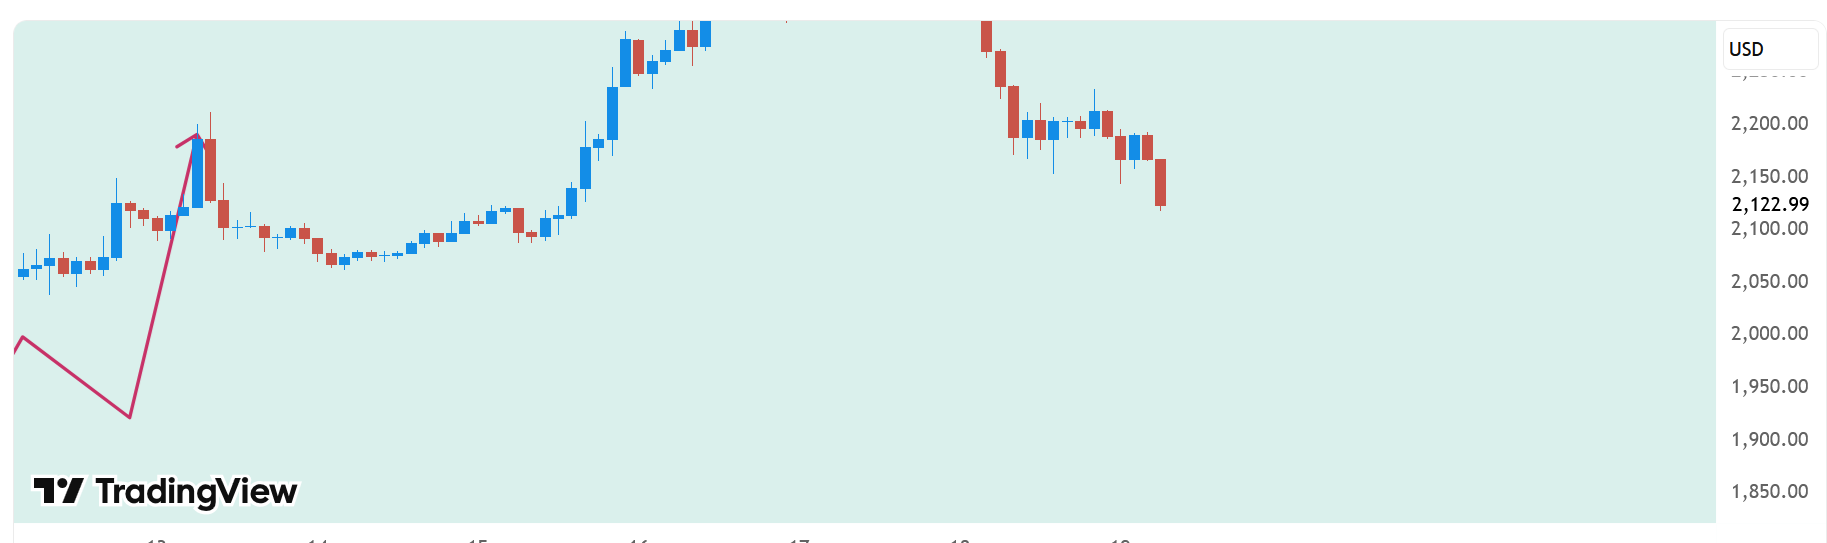
The chart illustrates a market that initially experienced a strong downward phase after reaching a previous peak. Following that decline, price entered a prolonged consolidation period where volatility compressed and directional momentum slowed. During this phase, the market moved sideways for several sessions, suggesting that participants were gradually accumulating positions while absorbing selling pressure.A turning point appeared once the market stopped extending lower and began forming internal rotations within the range. This behavior typically reflects a transition in sentiment as buyers begin to regain control after a period dominated by selling activity. Gradually, price started to push higher and created a recovery structure that lifted the market away from the consolidation base.
As the upward movement developed, Ethereum printed a fresh local peak inside the broader trading range. This move signaled increasing participation from buyers and confirmed that momentum had shifted toward expansion rather than continued compression. However, after reaching that recent high, price began to slow down and rotate downward, indicating that the market is currently entering a temporary corrective phase.
The most recent candles show a pullback from the latest peak, suggesting that the market is rebalancing liquidity after the previous impulse. Such retracements are common after strong directional moves, as they allow the market to revisit areas where significant orders previously entered. These rotations often help build the foundation for the next directional move.
From a broader perspective, the structure on the chart reflects a classic market cycle: distribution from the previous high, followed by stabilization, then a recovery push and finally a corrective rotation. The projected path drawn on the chart indicates the possibility of a deeper short-term pullback before momentum attempts another expansion phase.
If market participation returns during the corrective stage, Ethereum could potentially resume its upward trajectory after completing the current rebalancing process. The reaction during this pullback will be important in determining whether the broader recovery structure continues to develop or if the market transitions into a longer consolidation phase.
Overall, the chart suggests that ETHUSDT has shifted from a period of weakness toward a developing recovery trend, but the market is currently undergoing a natural pause as liquidity redistributes before the next potential directional move.