


BTC Trading Thoughts
Trading
2
Posts
2
Posters
52
Views
-
BTC’s relief rally is facing selling at the 20-day exponential moving average (EMA) ($68,895), indicating a negative sentiment.
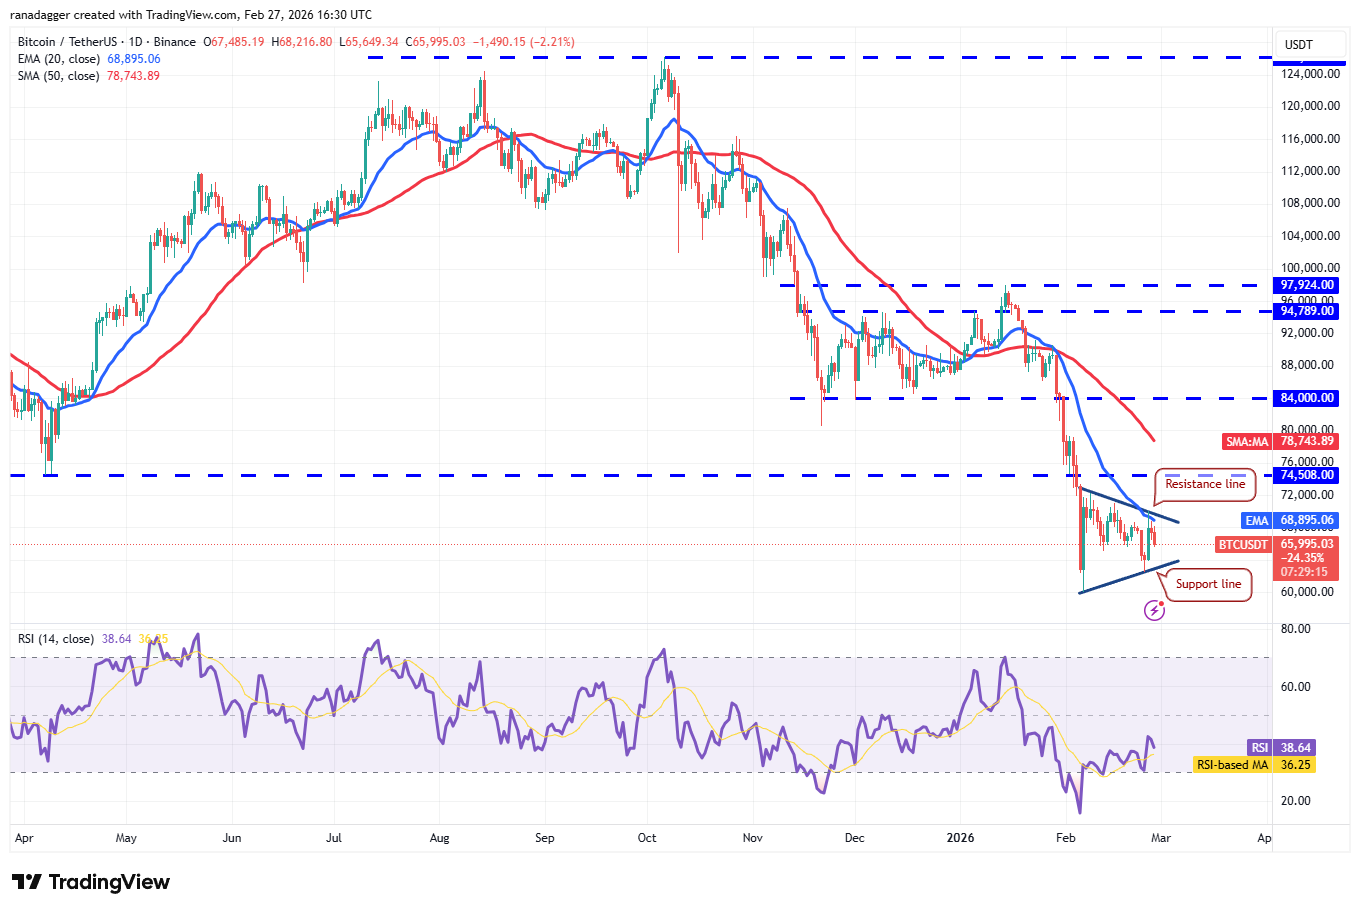
BTC/USDT daily chart. Source: Cointelegraph/TradingView
The BTC/USDT pair has formed a symmetrical triangle, which usually acts as a continuation pattern. If the Bitcoin price continues lower and breaks below the support line, it puts the $60,000 level at risk of breaking down. If that happens, the pair may plunge to the next major support at $52,500.The first sign of strength will be a close above the resistance line. The pair may then rally to the breakdown level of $74,508. This is a crucial level for the bears to defend, as a close above $74,508 suggests that the price may have bottomed out at $60,000.