Skip to content
  • Categories
  • Recent
  • Tags
  • Popular
  • World
  • Users
  • Groups
Collapse
Brand Logo
UDS UDS: $1.88
24h: 7.08%
Trade UDS
Gate.io
Gate.io
UDS / USDT
MEXC
MEXC
UDS / USDT
WEEX
WEEX
UDS / USDT
COINSTORE
COINSTORE
UDS / USDT
Biconomy.com
Biconomy.com
UDS / USDT
BingX
BingX
UDS / USDT
XT.COM
XT.COM
UDS / USDT
Uniswap v3
Uniswap v3
UDS / USDT
PancakeSwap v3
PancakeSwap v3
UDS / USDT

Earn up to 50 UDS per post

Post in Forum to earn rewards!

Learn more
UDS Right

Spin your Wheel of Fortune!

Earn or purchase spins to test your luck. Spin the Wheel of Fortune and win amazing prizes!

Spin now
Wheel of Fortune
selector
wheel
Spin

Paired Staking

Stake $UDS
APR icon Earn up to 50% APR
NFT icon Boost earnings with NFTs
Earn icon Play, HODL & earn more
Stake $UDS
Stake $UDS
UDS Left

Buy UDS!

Buy UDS with popular exchanges! Make purchases and claim rewards!

Buy UDS
UDS Right

Post in Forum to earn rewards!

UDS Rewards
Rewards for UDS holders
Rewards for UDS holders (per post)*
  • 100 - 999 UDS: 0.05 UDS
  • 1000 - 2499 UDS: 0.10 UDS
  • 2500 - 4999 UDS: 0.5 UDS
  • 5000 - 9999 UDS: 1.5 UDS
  • 10000 - 24999 UDS: 5 UDS
  • 25000 - 49999 UDS: 10 UDS
  • 50000 - 99 999 UDS: 25 UDS
  • 100 000 UDS or more: 50 UDS
*

Rewards are credited at the end of the day. Limited to 5 payable posts per day, 50 K holders - 3 posts per day, 100K holders - 2 posts per day. Staked UDS gives additional coefficient up to X1.5

  1. Home
  2. Hero Portfolio
  3. BTC has formed an Ascending Triangle in a Downtrend

BTC has formed an Ascending Triangle in a Downtrend

Scheduled Pinned Locked Moved Hero Portfolio
1 Posts 1 Posters 5 Views
  • Oldest to Newest
  • Newest to Oldest
  • Most Votes
Reply
  • Reply as topic
This topic has been deleted. Only users with topic management privileges can see it.
  • cryptobroC Offline
    cryptobroC Offline
    cryptobro
    wrote last edited by
    #1

    fb117534-812d-441d-94ab-555c8dbaa471-image.png What is Happening Here?

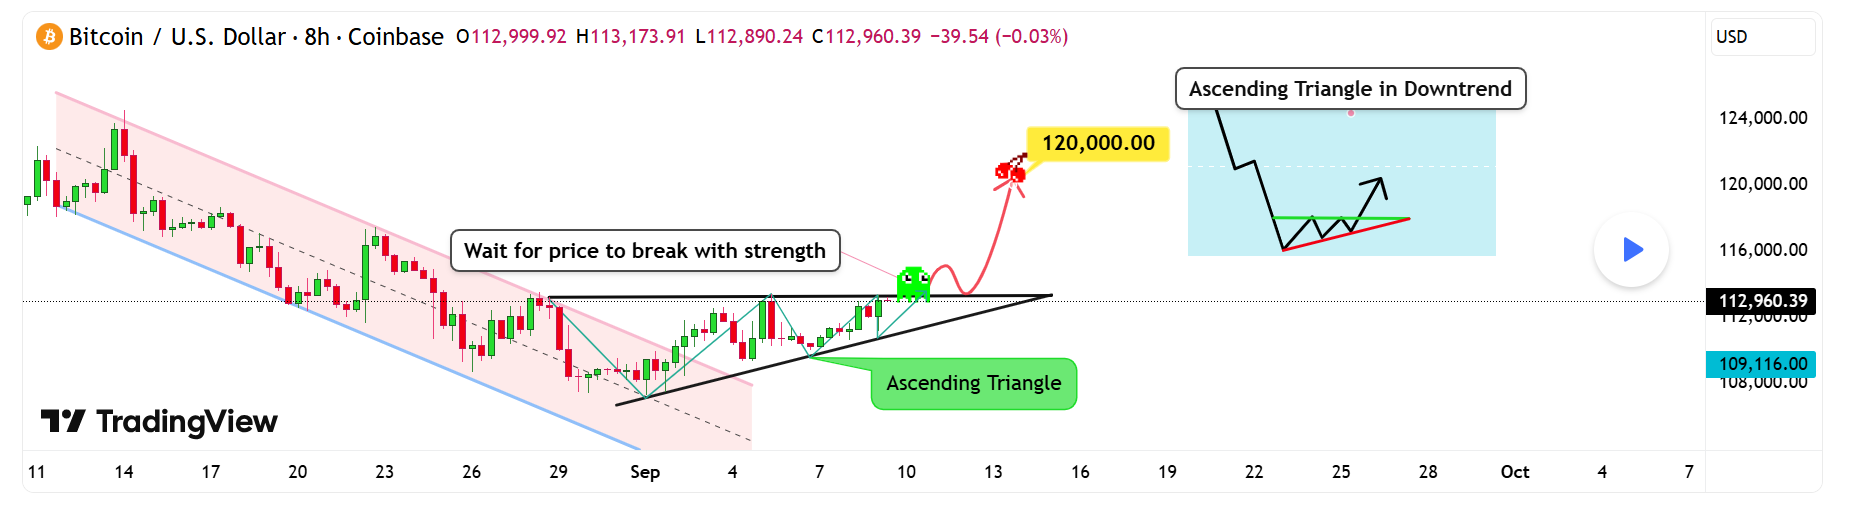
    If we take a look at Bitcoin, it's pretty interesting right now: we can observe an ascending triangle just formed. But this pattern took shape after a sharp drop in price.
    An ascending triangle is a bullish continuation pattern:

    • The resistance line stays horizontal (flat top).
    • The support line is rising, creating higher lows.

    So what does this mean?
    This indicates that buyers are gradually pushing prices higher while sellers are consistently defending the resistance level.
    And often with this pattern, the buying pressure overwhelms the sellers, causing a breakout to the upside.

    πŸ”Ή Breakout expectation:

    • Wait for breakout confirmation always! (strong candle close above resistance with volume), and/or on a retest of the broken resistance (now acting as support).
    • With this pattern, if it breaks above strongly, the target can typically be measured by taking the height of the triangle and adding it to the breakout level.

    πŸ”Ή Risk Factors:

    • False breakouts can occur (price temporarily breaks resistance but falls back inside).
    • If the pattern fails and price breaks below the rising trendline, it may signal bearish weakness.

    βœ… The reliability of the pattern increases on higher timeframes and with strong breakout volume.

    In summary
    An ascending triangle shows the following: Buyers are showing strength with rising lows, while resistance is being pressured repeatedly. A confirmed breakout above resistance could drive price toward a psychological target. Waiting for a strong breakout and possibly a retest helps reduce false signal risk.

    Not financial advice, just sharing my thoughts on the charts.
    Trade safely 😊

    1 Reply Last reply
    0


    Powered by NodeBB Contributors
    • First post
      Last post
    0
    • Categories
    • Recent
    • Tags
    • Popular
    • World
    • Users
    • Groups