


SOLANA Elliott Waves Analysis - 2D time frame - Christmas Gift
-
Solana is showing strong signals of a solid downtrend.
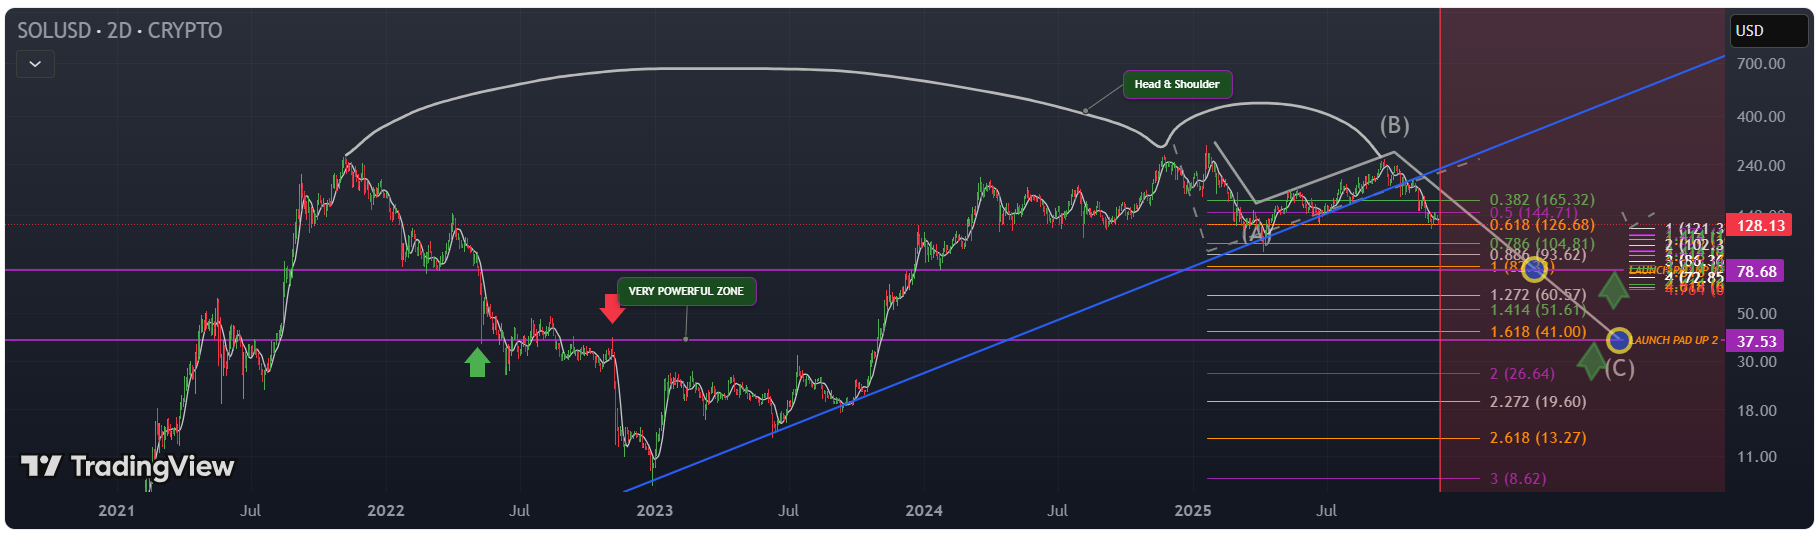
1st, the Blue Diagonal Trend line which we cannot miss, was broken, but also Retested & so confirming the Break. These Trend lines are powerful when they are traced correctly. This line connects 6 solid bottoms since 2022 as seen on the chart, thus breaking it is simply a very clear & loud declaration of a trend change.
2nd, we have reached a TOP/ATH in JAN 2025, followed by a deep correction of -68%. We had bullish trend after that in APRIL, that failed to breach that top.
That last top of SEP25 created a Head & Shoulder with NOV24.
The chart had a chance to prove its bullish intentions on 2 FAILED occasions. 1, 12-28OCT (weak green pullback) & 2, 5-11NOV (also weak green PB). these 2 Pullbacks were critical since they landed on strong support zones (180-187 & 146-157). both went to the drainage. this is already alarming by itself.
The WHOLE GREEN LEG from APRIL 7 till SEP 18 was doomed @ the 2nd Failed Pullback.
Some might argue that we still have the 120 level as a support. TRUE, yet I don't think it stands a chance with the coming Tsunami.
It makes more sense now that we are in ABC correction as seen on the chart starting JAN 25. the C wave has completed 3 waves within its 5 legs. 5th wave has already started on NOV 25 @ around 6. the proof for this, is the depletion in the last red leg (check 4hrs time frame) and also, the new top we made Wednesday NOV26 reached 99% retracement of the previous top. telling us: I AM WAVE 2. wave 3 started with sub waves 1 & 2, and sub wave 3 just started at 15:30 today and showing its might at 1 am, 1st of December.
Wave C has 2 main potential landing sites. one, around 78 which coincided with Fibonacci extension 1 (perfect for C waves), and another deeper one which i favor around 37 which coincides with 1.618 Fibonacci (extended C). the latter has a more powerful support zone when you look at dates May 22 till Nov 22 (as seen on chart).
The wave 5 will have to be quite extended though to reach the 37 mark.
Safe Trade.
-
SOL’s Elliott Wave structure hints at a possible holiday rally.
-
The wave count suggests a strong upside push if support holds.