


Dash breaks a six-month descending trendline and the weekly chart is pointing to much higher targets
-
Dash's 23.73% single-day move on May 4 is significant primarily because of what it broke rather than the percentage gain itself. The descending trendline from the November 2025 high at $150 had rejected every rally attempt for six months, establishing a clear pattern of lower highs that defined the bear structure. The breakout candle on May 4 came with the largest daily volume since early February, providing the volume confirmation that distinguishes genuine trendline breaks from false ones. Daily RSI broke into the upper band simultaneously and MACD posted a fresh bullish cross, giving the breakout three independent technical confirmations on the same timeframe. A close above $51 would flip prior resistance to support and fully validate the structure, with the next supply zone at the 0.5 Fibonacci retracement near $54.45.
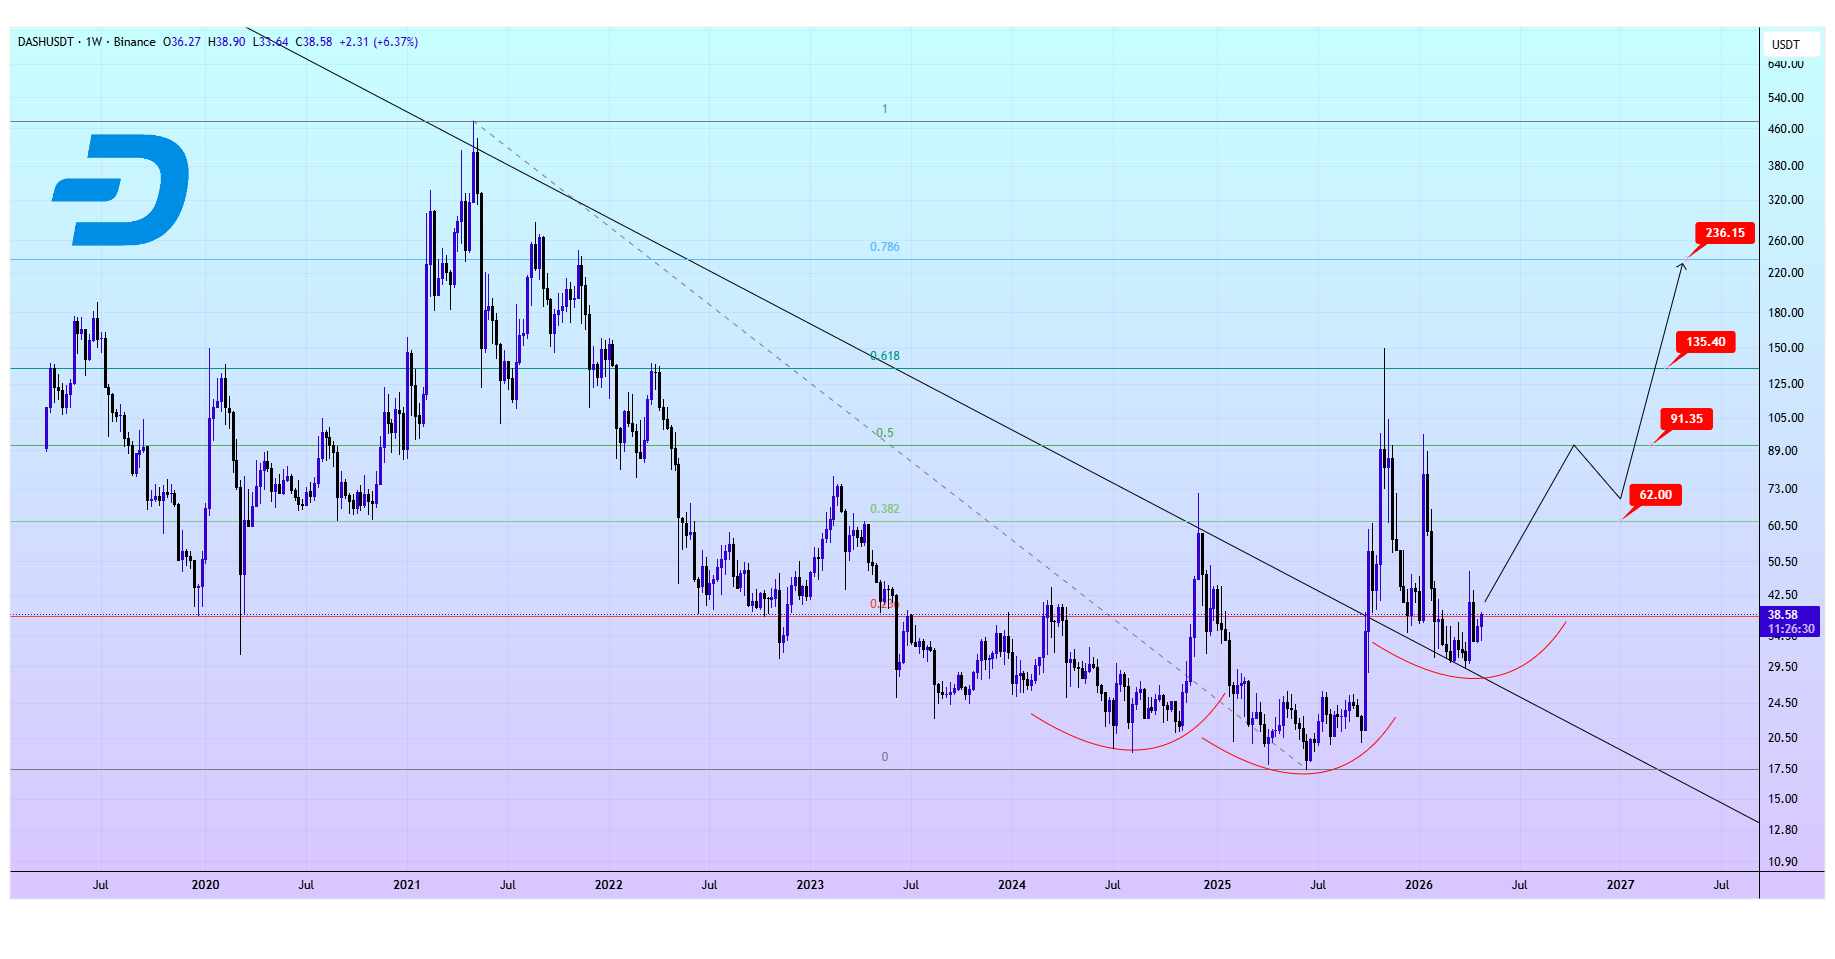
The weekly chart adds a longer-term dimension that makes the setup more compelling. Analyst cryptclay has identified a confirmed higher low and an inverse head-and-shoulders pattern on the weekly timeframe, a combination that when validated by a trendline retest projects targets at $62, $91.35, $135.40, and $236.15. The November 2025 high of $93 represents the first major upside target for traders thinking in terms of trend recovery rather than short-term scalps. The invalidation scenario is clear: a failed breakout that closes back below the trendline would put the 0.786 Fibonacci retracement at $30.49 back in play as long-term support. The risk-reward structure from current levels is favorable for traders who can define their stop below the breakout zone and hold against the measured move targets.
-
Dash broke a six month trendline and I had completely forgotten Dash existed, welcome back old friend
-
$51 flipping from resistance to support is the near-term binary that separates genuine breakout from extended false move on daily timeframe.