


Bitcoin at $80,000 looks bullish on the daily chart but the 4-hour setup flags a possible drop to $75,000
-
Bitcoin's reclaim of $80,000 presents a split technical picture depending on which timeframe you are watching, and the divergence between the daily and 4-hour charts makes the next 24 to 48 hours unusually significant for determining whether the breakout is genuine or a false start. On the daily chart the case is straightforwardly constructive: the descending trendline from April 13 has been cleared, the 20-day moving average is holding as support, RSI is trending higher without bearish divergence, and MACD has flipped with a bullish crossover. The technical structure supports continuation toward $85,000 and potentially $100,900 at the 0.618 Fibonacci retracement if momentum holds.
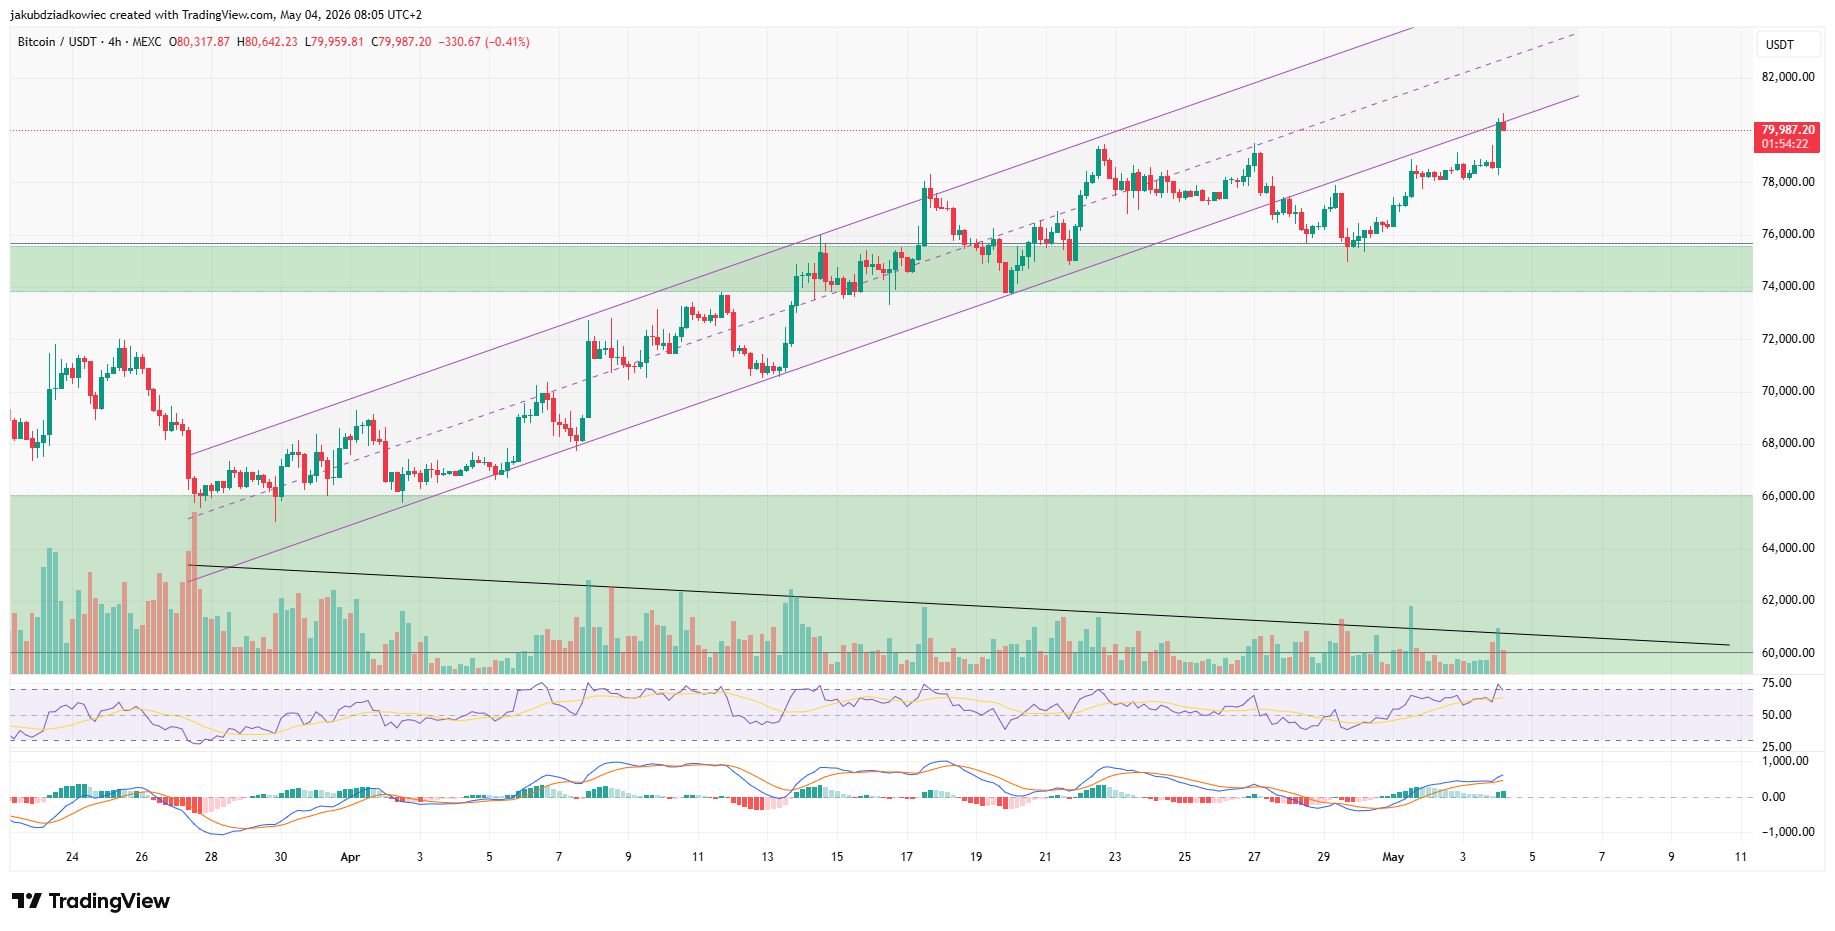
The 4-hour chart complicates that narrative in two specific ways. First, RSI on the 4-hour timeframe has pushed into overbought territory, suggesting the immediate leg may be extended. Second, and more structurally concerning, Bitcoin broke down from the lower band of a parallel ascending channel it had traded within since March 26, and the current price action around $80,000 looks like a retest of that broken channel from below. If the lower band now acts as resistance rather than support, the textbook technical expectation would be a move back toward $75,000, where Bitcoin would need to defend the 0.236 Fibonacci retracement and the rising 50-day moving average. Losing that level would invalidate the broader bullish thesis and potentially trigger a deeper retracement. The bullish scenario requires a decisive 4-hour close back inside the broken channel, which would confirm the current move as a genuine reclaim rather than a rejection retest. Until that close materializes, both scenarios remain live and position sizing should reflect that uncertainty rather than assuming the daily chart momentum is already confirmed.