


BTCUSDT: Triangle Resistance Holds, Downside To 68K Risk Remains
-
Hello everyone, here is my breakdown of the current BTCUSDT setup.
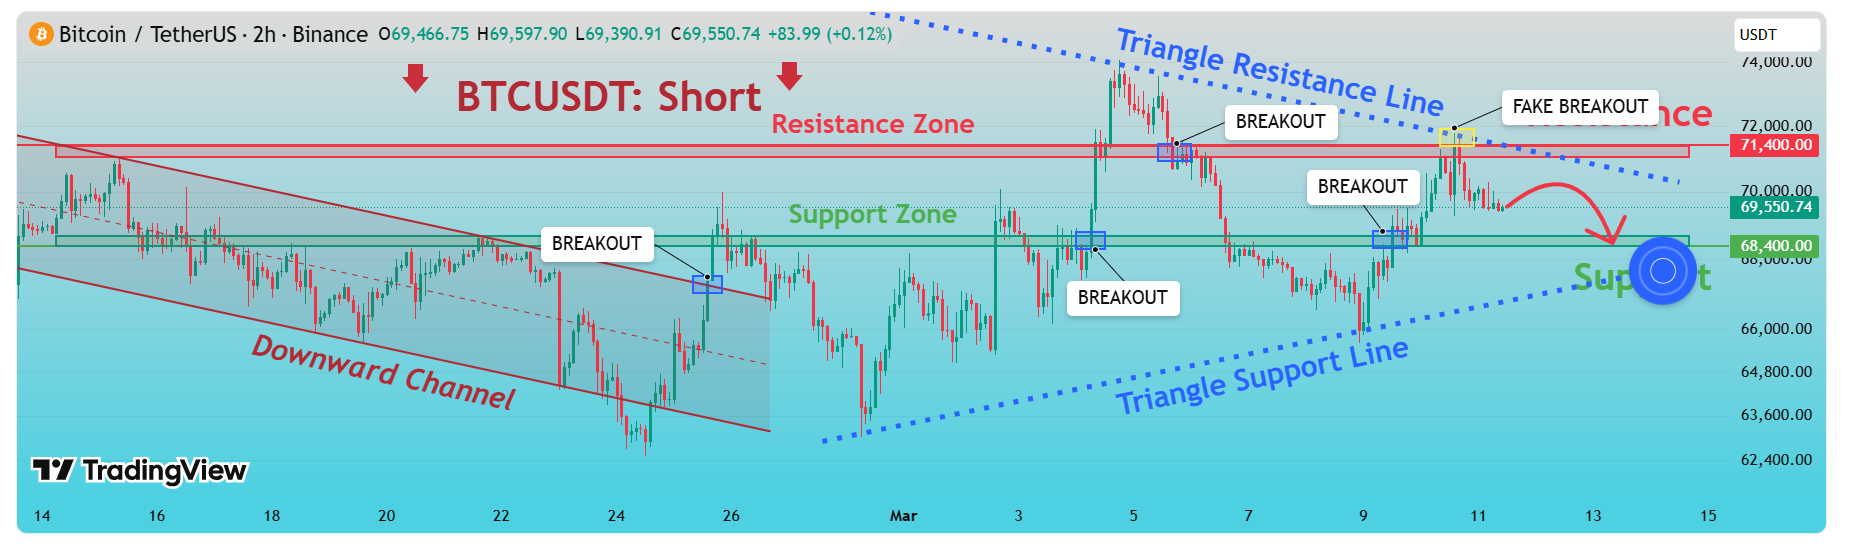
Market AnalysisBTC previously traded inside a downward channel, forming lower highs and lower lows. Price later broke above the channel resistance, signaling a short-term bullish shift. After the breakout, the market formed a symmetrical triangle, with a descending resistance line and a rising support line. The 68,400 level acts as a strong support zone, where buyers repeatedly defended the market.
Currently, BTC attempted to break the 71,400 resistance, but the move resulted in a fake breakout, confirming strong selling pressure at this level.
My Scenario & Strategy
As long as BTCUSDT remains below the 71,400 resistance level and continues respecting the triangle resistance line, the market may face further downside pressure. In this scenario, price could decline toward the 68,400 support zone, which represents the next key reaction level and the primary downside target.
However, if buyers manage to produce a clean breakout above the 71,400 resistance zone, the bearish scenario would weaken significantly and could trigger a stronger bullish continuation toward higher resistance levels.
That’s the setup I’m tracking. Thank you for your attention, and always manage your risk.