


BTCUSDT Long: Holding Above Demand, Eyes on 91,800 Retest
-
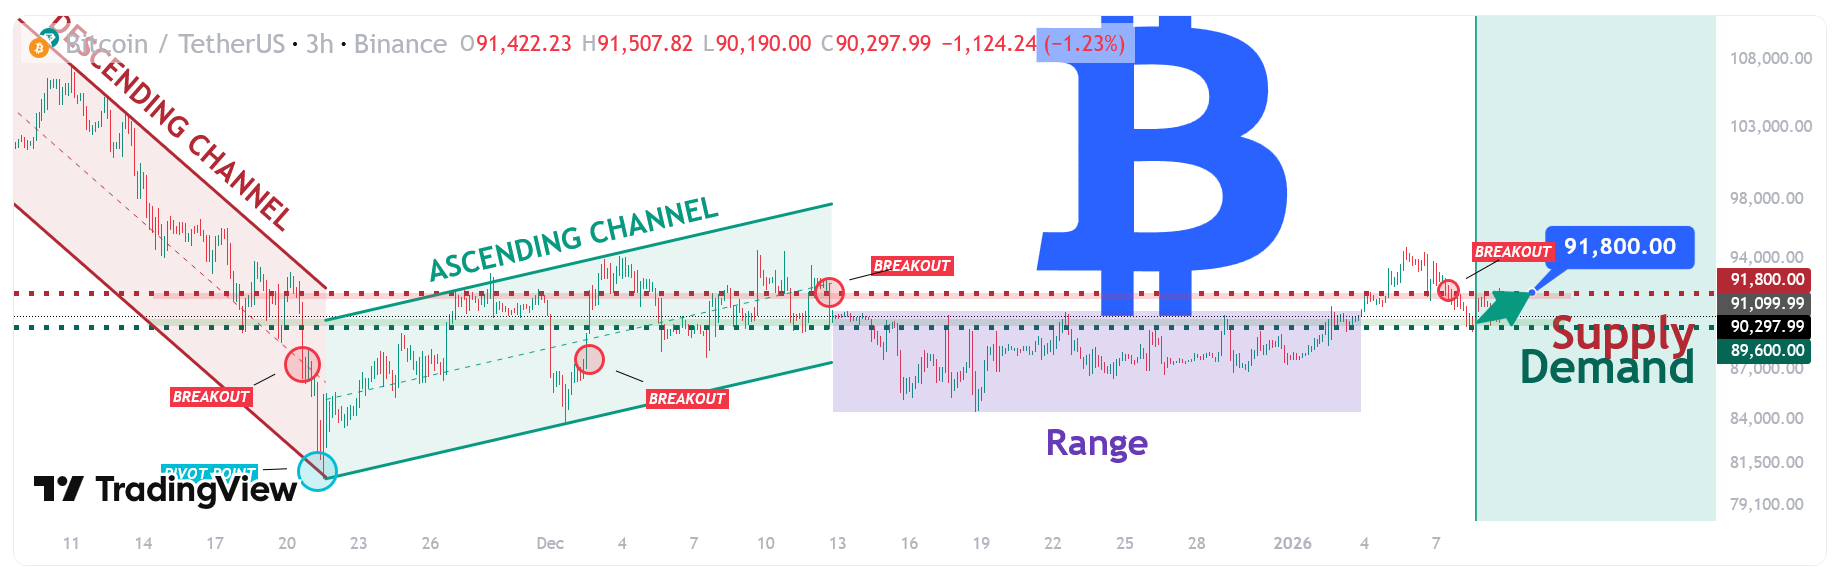
Hello traders! Here’s a clear technical breakdown of BTCUSDT (3H) based on the current chart structure. BTCUSDT initially traded within a well-defined descending channel, where price consistently respected the lower highs and lower lows, confirming strong bearish pressure. This bearish structure eventually reached a key pivot point, from which price reversed and broke out of the descending channel to the upside. This breakout marked a structural shift and initiated a new ascending channel, signaling a transition from bearish to bullish control. Following this rejection, BTCUSDT moved into a range, highlighting temporary equilibrium between buyers and sellers. From this range, price attempted another push higher, once again testing the supply zone. The most recent price action shows rejection from the same area, reinforcing the importance of this resistance.Currently, BTCUSDT is consolidating between clearly defined Demand (~89,600) and Supply (~91,800) zones after transitioning from a descending channel into an ascending structure. Despite the recent rejection from the supply zone, the overall market structure remains bullish as long as price holds above the key demand area.
My primary scenario: long bias remains valid as long as BTCUSDT holds above the 89,600 Demand Zone and no strong bearish acceptance occurs below this level. I expect buyers to continue defending the demand area, forming a higher low or showing a clear bullish reaction (long lower wicks, impulsive bounce, or an internal break of structure). Once buyer strength is confirmed, a move toward: TP1: a retest of the 91,800 Supply Zone. TP2: in case of a clean breakout and acceptance above 91,800, continuation toward new local highs. Manage your risk!