Skip to content
  • Categories
  • Recent
  • Tags
  • Popular
  • World
  • Users
  • Groups
Collapse
Brand Logo
UDS UDS: $2.2149
24h: -0.70%
Trade UDS
Gate.io
Gate.io
UDS / USDT
KuCoin
KuCoin
UDS / USDT
MEXC
MEXC
UDS / USDT
BingX
BingX
UDS / USDT
BitMart
BitMart
UDS / USDT
LBank
LBank
UDS / USDT
XT.COM
XT.COM
UDS / USDT
Uniswap v3
Uniswap v3
UDS / USDT
Biconomy.com
Biconomy.com
UDS / USDT
WEEX
WEEX
UDS / USDT
PancakeSwap v3
PancakeSwap v3
UDS / USDT
Pionex
Pionex
UDS / USDT
COINSTORE
COINSTORE
UDS / USDT
Sushiswap v3
Sushiswap v3
UDS / USDT
Picol
Picol
UDS / USDT

Earn up to 50 UDS per post

Post in Forum to earn rewards!

Learn more
UDS Right

Spin your Wheel of Fortune!

Earn or purchase spins to test your luck. Spin the Wheel of Fortune and win amazing prizes!

Spin now
Wheel of Fortune
selector
wheel
Spin

Paired Staking

Stake $UDS
APR icon Earn up to 50% APR
NFT icon Boost earnings with NFTs
Earn icon Play, HODL & earn more
Stake $UDS
Stake $UDS
UDS Left

Buy UDS!

Buy UDS with popular exchanges! Make purchases and claim rewards!

Buy UDS
UDS Right

Post in Forum to earn rewards!

UDS Rewards
  1. Home
  2. Trading
  3. SOLUSDT

SOLUSDT

Scheduled Pinned Locked Moved Trading
3 Posts 3 Posters 4 Views
  • Oldest to Newest
  • Newest to Oldest
  • Most Votes
Reply
  • Reply as topic
This topic has been deleted. Only users with topic management privileges can see it.
  • cryptobroC Offline
    cryptobroC Offline
    cryptobro
    wrote on last edited by
    #1

    47cf0c25-7997-46b3-af5e-33b4713a1b3c-image.png 
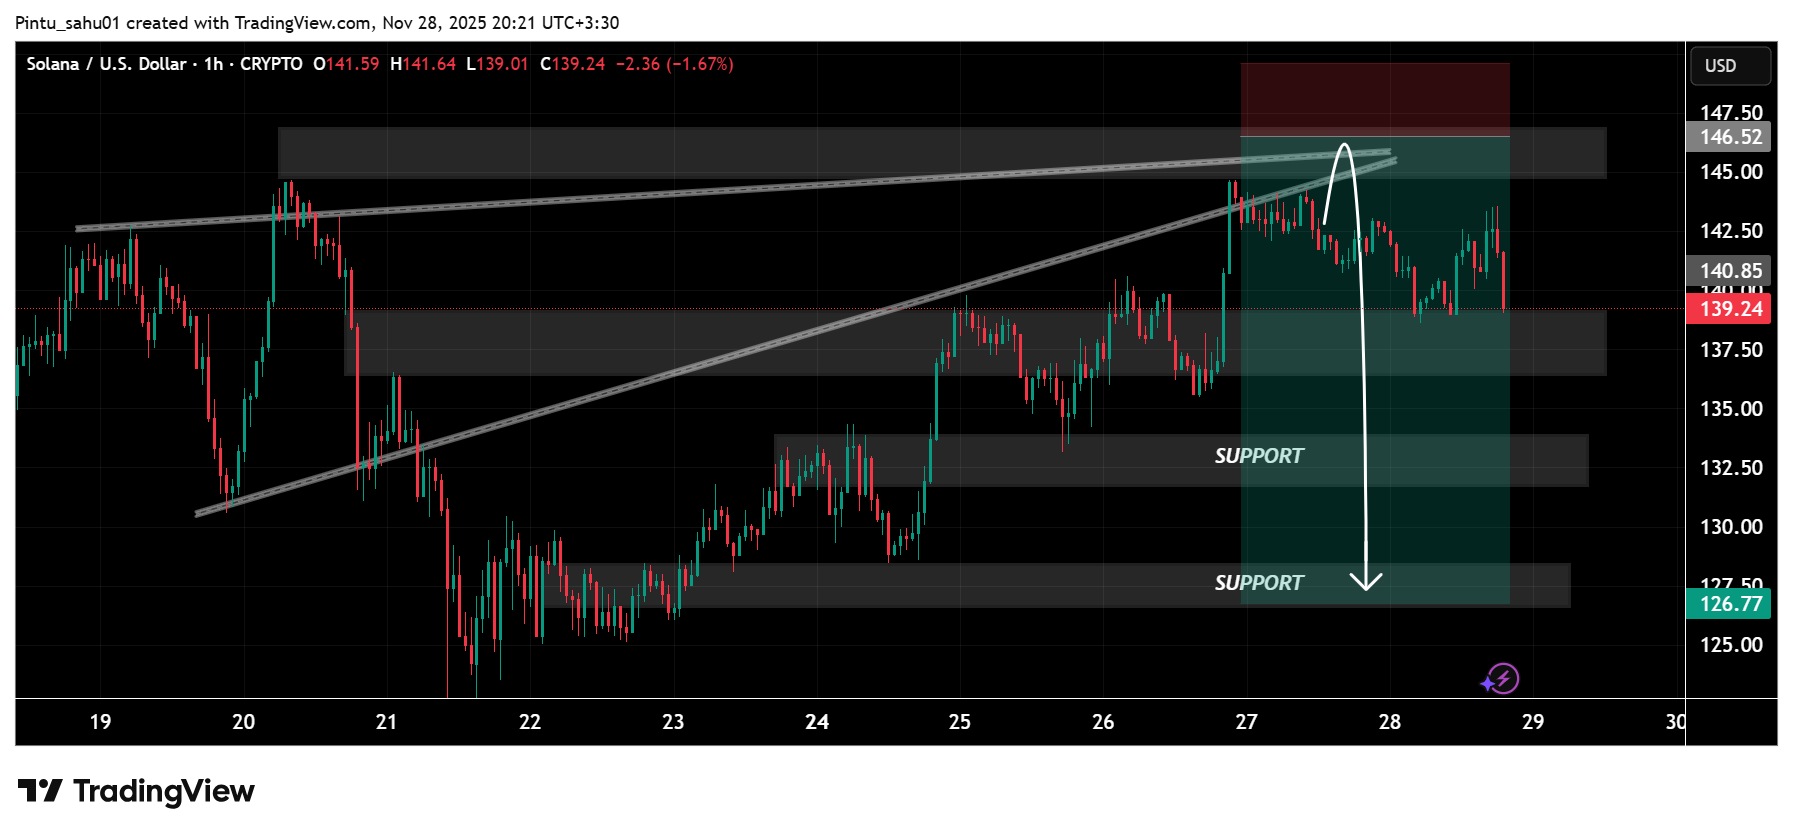
Solana against the U.S. Dollar on the 1-hour timeframe, with several technical elements highlighted to visualize a potential bearish reversal setup

    🔹 Overall Structure

    The price recently climbed into a rising wedge pattern, indicated by two converging trendlines. These trendlines slope upward but gradually tighten, showing weakening bullish momentum as the price attempts to push higher. The rising wedge is often considered a bearish reversal pattern, especially when it forms near a strong resistance area.

    🔹 Resistance Zone

    At the top of the wedge, there is a clearly marked resistance zone between approximately $145 and $147.50. This zone is shaded in red, representing a potential area where buyers might exhaust and sellers begin to dominate the chart illustrates a possible fake out or final push upward, where the price momentarily spikes above the wedge before sharply falling. This pattern often traps late buyers and triggers a strong downward move.

    Support Levels

    Two key support zones are marked:

    1st Support: Around 132
    2nd Support; Around 128

    These zones represent areas where the price may temporarily pause or consolidate during the decline.

    If you find it helpful please like and comments for this post and share thanks.

    1 Reply Last reply
    0
    • Nahid HossenN Offline
      Nahid HossenN Offline
      Nahid Hossen
      wrote on last edited by
      #2

      SOL price action stays impressive—dip buyers remain active.

      Nike

      1 Reply Last reply
      0
      • Abdul KhanA Offline
        Abdul KhanA Offline
        Abdul Khan
        wrote on last edited by
        #3

        Watching liquidity pockets here for the next decisive move.

        1 Reply Last reply
        0


        • Login or register to search.
        Powered by NodeBB Contributors
        • First post
          Last post
        0
        • Categories
        • Recent
        • Tags
        • Popular
        • World
        • Users
        • Groups