Skip to content
  • Categories
  • Recent
  • Tags
  • Popular
  • World
  • Users
  • Groups
Collapse
Brand Logo
UDS UDS: $2.1822
24h: -1.81%
Trade UDS
Gate.io
Gate.io
UDS / USDT
KuCoin
KuCoin
UDS / USDT
MEXC
MEXC
UDS / USDT
BingX
BingX
UDS / USDT
BitMart
BitMart
UDS / USDT
LBank
LBank
UDS / USDT
XT.COM
XT.COM
UDS / USDT
Uniswap v3
Uniswap v3
UDS / USDT
Biconomy.com
Biconomy.com
UDS / USDT
WEEX
WEEX
UDS / USDT
PancakeSwap v3
PancakeSwap v3
UDS / USDT
Pionex
Pionex
UDS / USDT
COINSTORE
COINSTORE
UDS / USDT
Sushiswap v3
Sushiswap v3
UDS / USDT
Picol
Picol
UDS / USDT

Earn up to 50 UDS per post

Post in Forum to earn rewards!

Learn more
UDS Right

Spin your Wheel of Fortune!

Earn or purchase spins to test your luck. Spin the Wheel of Fortune and win amazing prizes!

Spin now
Wheel of Fortune
selector
wheel
Spin

Paired Staking

Stake $UDS
APR icon Earn up to 50% APR
NFT icon Boost earnings with NFTs
Earn icon Play, HODL & earn more
Stake $UDS
Stake $UDS
UDS Left

Buy UDS!

Buy UDS with popular exchanges! Make purchases and claim rewards!

Buy UDS
UDS Right

Post in Forum to earn rewards!

UDS Rewards
  1. Home
  2. Trading
  3. FARTCOIN | Breakout Retest and Long-Term Structure Play

FARTCOIN | Breakout Retest and Long-Term Structure Play

Scheduled Pinned Locked Moved Trading
3 Posts 3 Posters 6 Views
  • Oldest to Newest
  • Newest to Oldest
  • Most Votes
Reply
  • Reply as topic
This topic has been deleted. Only users with topic management privileges can see it.
  • mendezM Offline
    mendezM Offline
    mendez
    wrote on last edited by
    #1

    ba52054a-c96c-4ca8-a784-f2492c27191d-image.png 
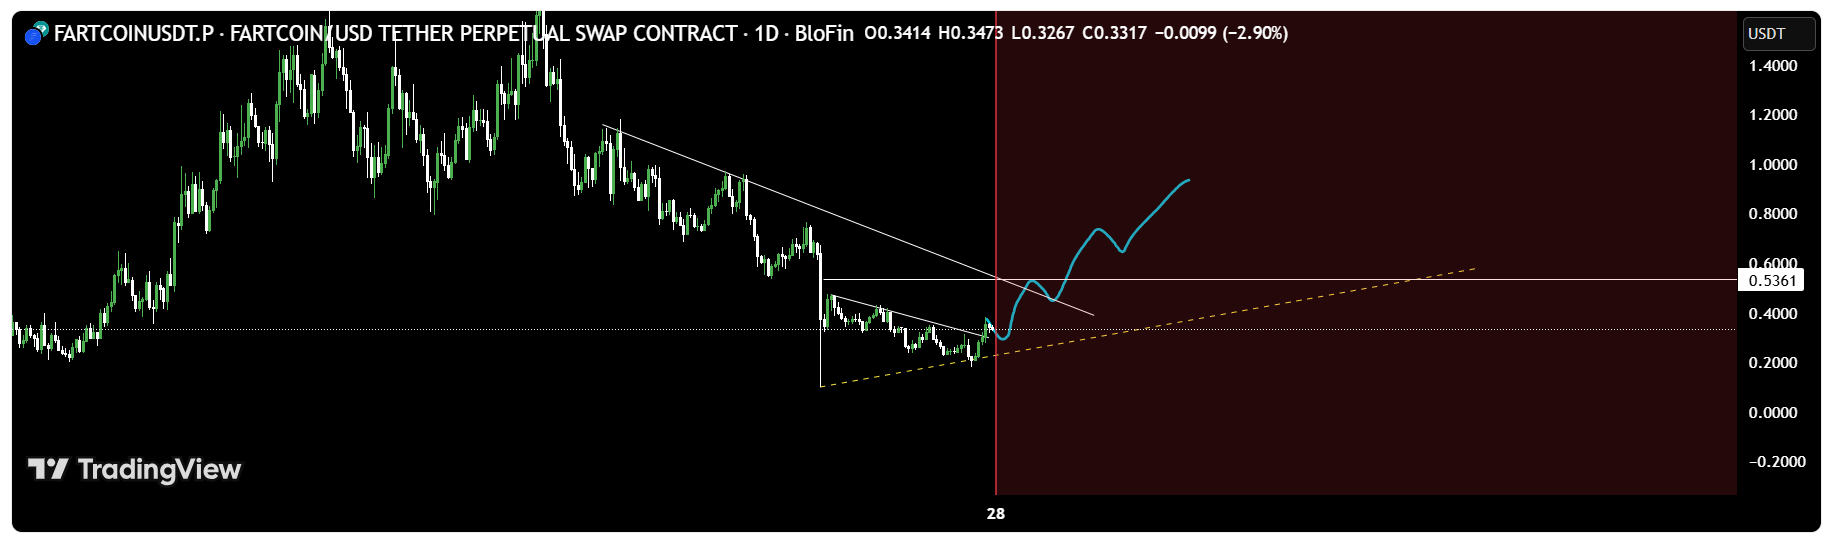
After a long period of compression, FARTCOIN (FART/USDT) is showing early signs of a potential trend reversal on the 1D chart.

    Price has respected a descending resistance line for months while simultaneously forming higher lows on the ascending yellow trendline — signaling that bullish pressure may be building.

    Currently, price is testing the intersection point between descending resistance and ascending support, forming what could be a symmetrical triangle breakout setup.
    If we can hold above the breakout area and reclaim the mid-structure level (~0.40–0.42), the next technical objectives would be:

    TP1: 0.56 – Retest of prior structural resistance
    TP2: 0.73 – Measured move from the breakout pattern
    TP3: 1.00+ – Potential full cycle expansion target

    ⚠️ Invalidation:
    A daily candle close below 0.30 would suggest a failed breakout and continuation of the prior downtrend.

    Educational Breakdown:
    This setup is designed to teach how trendline confluence + structural compression can reveal early trend reversal zones.
    Notice how the breakout leg aligns with a swing projection pattern, confirming momentum shift probability.

    Bias:
    Directional Bias: Bullish
    Setup Type: Breakout + Retest (Mid-term swing)
    Timeframe: 1D

    1 Reply Last reply
    0
    • Nahid HossenN Offline
      Nahid HossenN Offline
      Nahid Hossen
      wrote on last edited by
      #2

      Solid breakout-retest behavior—structure looks surprisingly strong.

      Nike

      1 Reply Last reply
      0
      • Rimon KhanR Offline
        Rimon KhanR Offline
        Rimon Khan
        wrote on last edited by
        #3

        If this level holds, long-term continuation could be very interesting.

        1 Reply Last reply
        0


        • Login or register to search.
        Powered by NodeBB Contributors
        • First post
          Last post
        0
        • Categories
        • Recent
        • Tags
        • Popular
        • World
        • Users
        • Groups