


ETH | Monthly
-
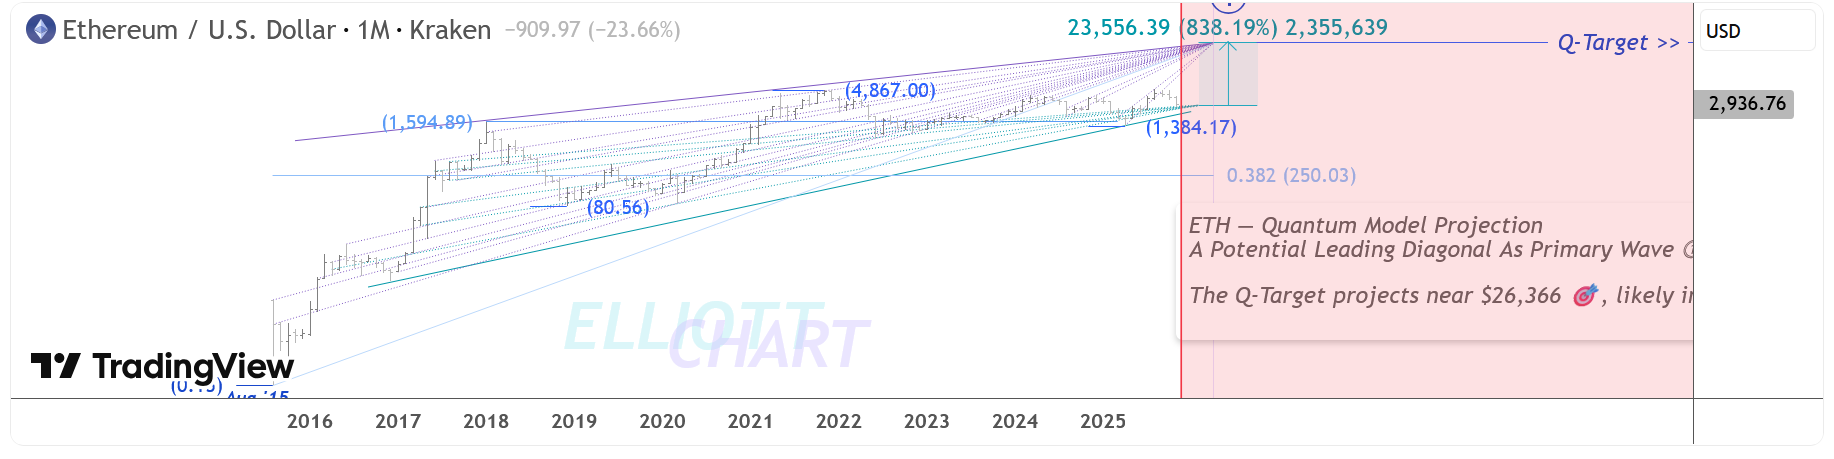
ETH — Quantum Model Projection
Primary Wave ⓵ Near Completion | Q-Target: $26,366
Based on the Monthly chart structure, Ethereum’s long-term ascent since August 2015 appears to be forming a Leading Diagonal in Primary Wave ⓵. This wave remains in its late stage, with a final surge within Intermediate Wave (5)(not labelled on this chart) likely developing into early April.
The Quantum Target aligns with a projected advance toward $26,366 .
.
The emergence of a Leading Diagonal at the Primary degree is a notably bullish early-cycle signature, often signaling the transition from a broad accumulation phase into a developing trend extension. Within my framework, such diagonal motives — once followed by a corrective Primary Wave ⓶ retracement — typically precede powerful impulsive expansions in Primary Wave ⓷.This structure supports a broader bullish narrative at the Cycle degree, suggesting that ETHEREUM is preparing for a major, multi-year uptrend as the larger wave sequence unfolds.
 In my Quantum Models methodology, the equivalence lines function as structural elements, anchoring the model’s internal geometry and framing the progression of alternate paths.
#QuantumModel #TrendAnalysis #WaveAnalysis #MarketStructure #CryptoAnalysis -
ETH’s monthly structure looks strong—momentum is clearly building.
-
If this trend holds, we may see a solid continuation upwards.
-
R — typically precede powerful impulsive expansions in Primary Wave.
-
ETH’s monthly structure is stabilizing, hinting at a potential long-term push.