


GBPUSD Technical Target Analysis (1H Chart)...
-
 GBPUSD Technical Target Analysis (1H Chart)
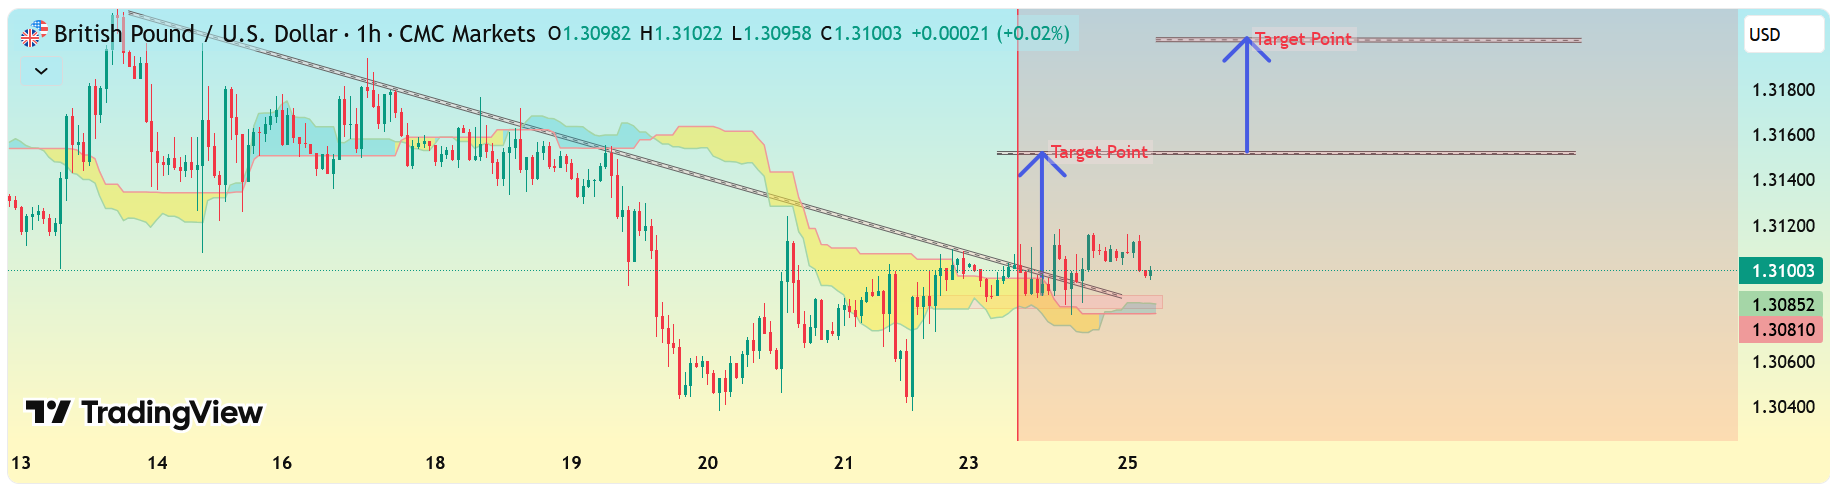
My chart shows:
A descending trendline that price is currently testing.
Price is sitting inside the Ichimoku cloud, attempting to break upward.
Two Target Point levels marked on my chart.
Based on the structure visible:
 Target Levels From my Chart
 Target 1 — Short-Term / First Resistance
 1.3150 – 1.3160 zone
This is the level my marked as my first target.
It matches:First major horizontal resistance
A typical breakout-level retest
Mid-range liquidity zone
This is a logical TP1 after a trendline break.
Target 2 — Extended Target / Full Bullish Move 1.3195 – 1.3205 zoneThis is my second “Target Point” at the top.
It aligns with:Higher-timeframe resistance
Prior rejection zone
Completion of a measured move
This is the likely TP2 if price pushes fully out of the cloud and breaks the trendline cleanly.
🧭 Summary
Target Price Zone Reason
Target 1 1.3150 – 1.3160 First major resistance after breakout
Target 2 1.3195 – 1.3205 Next structural high + full extension -
1H structure looks bullish but momentum seems weak.
-
Targets make sense—just need cleaner market direction.