


USDT DOMINANCE Analysis | Altseason Or New Bearish Cycle (3D)
-
 Before anything else, pay close attention to the timeframe. This analysis is based on the 3-hour timeframe, and it naturally takes time to unfold.
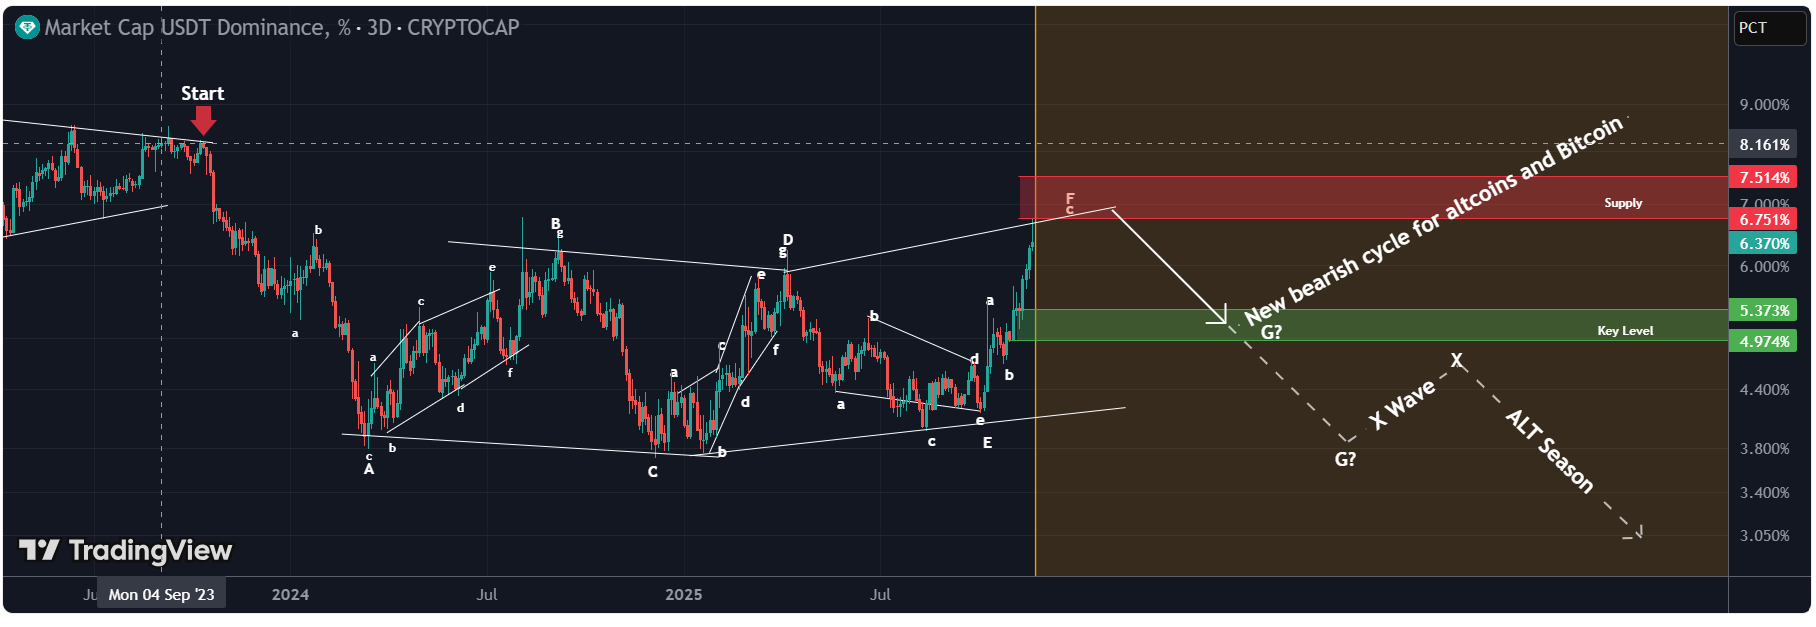
From the point where we placed the red arrow on the chart, it seems that the correction of USDT dominance has begun. This correction is forming a Diametric pattern, and we are currently at the end of wave F.
From the red zone, we expect a rejection to the downside, because wave F ends in this area and we will enter wave G, which is a bearish wave. During this bearish wave, Bitcoin and altcoins will experience some degree of recovery.
However, based on NeoWave wave-counting principles, in the green zone either:
- The correction of USDT dominance will be completed and it will enter a mid-term bullish phase, leading Bitcoin and altcoins into another bearish cycle,
or
- Wave G of this USDT dominance pattern will extend, and instead of a new bullish phase, an X wave will form. In this scenario, USDT dominance will enter another downward cycle, which could trigger an altseason.
We have to see which scenario plays out!
What do you think?Comment if you have any questions
-
USDT dominance is the cleanest signal for risk appetite—watching closely.

-
If dominance rises, alts will feel the heat fast.