Skip to content
  • Categories
  • Recent
  • Tags
  • Popular
  • World
  • Users
  • Groups
Collapse
Brand Logo
UDS UDS: $2.1808
24h: -1.37%
Trade UDS
Gate.io
Gate.io
UDS / USDT
KuCoin
KuCoin
UDS / USDT
MEXC
MEXC
UDS / USDT
BingX
BingX
UDS / USDT
BitMart
BitMart
UDS / USDT
LBank
LBank
UDS / USDT
XT.COM
XT.COM
UDS / USDT
Uniswap v3
Uniswap v3
UDS / USDT
Biconomy.com
Biconomy.com
UDS / USDT
WEEX
WEEX
UDS / USDT
PancakeSwap v3
PancakeSwap v3
UDS / USDT
Pionex
Pionex
UDS / USDT
COINSTORE
COINSTORE
UDS / USDT
Sushiswap v3
Sushiswap v3
UDS / USDT
Picol
Picol
UDS / USDT

Earn up to 50 UDS per post

Post in Forum to earn rewards!

Learn more
UDS Right

Spin your Wheel of Fortune!

Earn or purchase spins to test your luck. Spin the Wheel of Fortune and win amazing prizes!

Spin now
Wheel of Fortune
selector
wheel
Spin

Paired Staking

Stake $UDS
APR icon Earn up to 50% APR
NFT icon Boost earnings with NFTs
Earn icon Play, HODL & earn more
Stake $UDS
Stake $UDS
UDS Left

Buy UDS!

Buy UDS with popular exchanges! Make purchases and claim rewards!

Buy UDS
UDS Right

Post in Forum to earn rewards!

UDS Rewards
  1. Home
  2. Trading
  3. Alts Market Cap (#ALTS) Weekly Chart Update & Analysis.

Alts Market Cap (#ALTS) Weekly Chart Update & Analysis.

Scheduled Pinned Locked Moved Trading
1 Posts 1 Posters 6 Views
  • Oldest to Newest
  • Newest to Oldest
  • Most Votes
Reply
  • Reply as topic
This topic has been deleted. Only users with topic management privileges can see it.
  • tradelikeproT Offline
    tradelikeproT Offline
    tradelikepro
    wrote on last edited by
    #1

    e183594d-b992-4371-af7d-daa7a1f81e17-image.png Alts Market Cap (#ALTS) Weekly Chart Update & Analysis

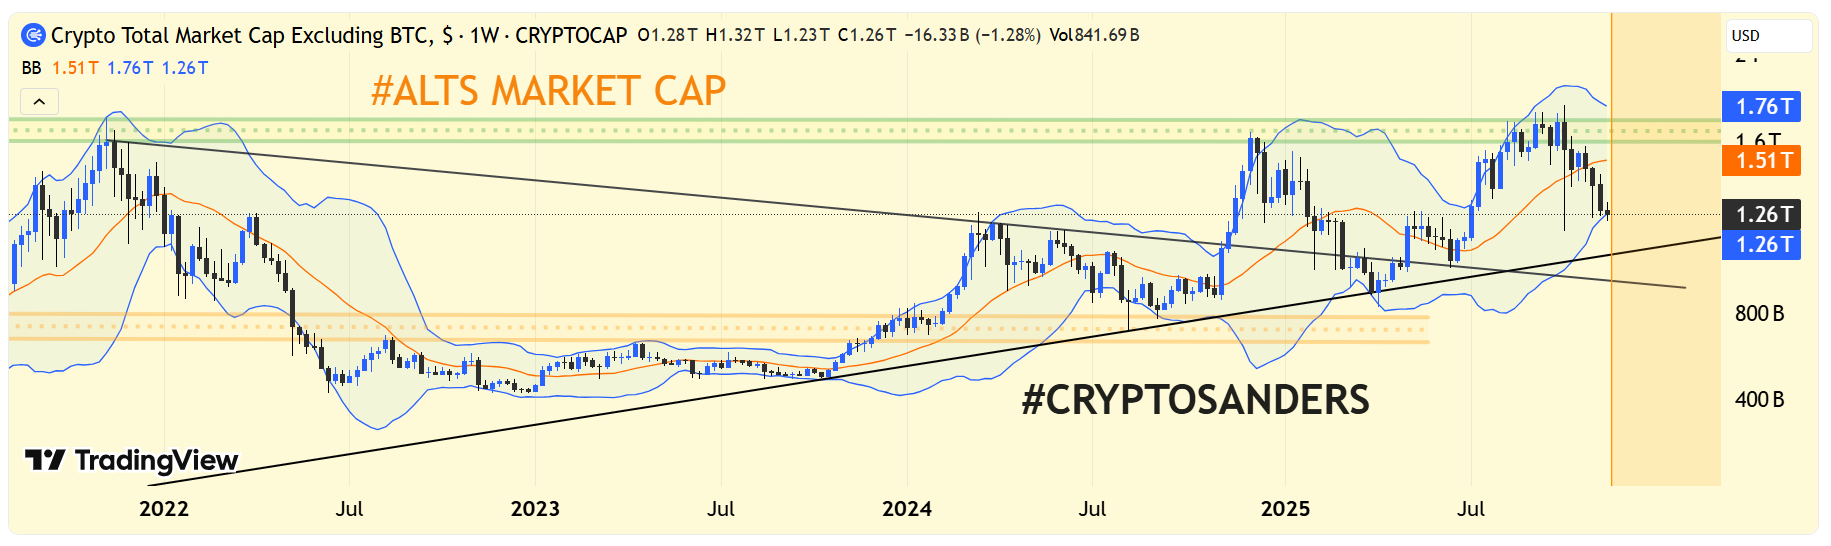
    Trend Structure: The altcoin market cap (total crypto market cap excluding BTC) is trading within a broad uptrend channel after a major breakout in early 2024.​

    Support is currently found near $1.25T (recent swing low and channel support).
    Resistance remains around $1.51T (orange line) and $1.76T (major horizontal/upper Bollinger Band zone).

    Bollinger Bands: The chart uses weekly Bollinger Bands—price has pulled back from the upper band ($1.76T) and is now holding the midline ($1.26T) as short-term support.

    A successful hold above $1.25T keeps the uptrend intact and sets the stage for a move back to $1.51–$1.76T.
    A breakdown could lead to a deeper dip toward the long-term rising trendline (currently around $1T).

    Alts are consolidating at higher lows inside an uptrend. Holding above the $1.25T area signals strength; a break above $1.51T confirms fresh upside momentum, while losing $1.25T would signal caution for further corrections.

    1 Reply Last reply
    0


    • Login or register to search.
    Powered by NodeBB Contributors
    • First post
      Last post
    0
    • Categories
    • Recent
    • Tags
    • Popular
    • World
    • Users
    • Groups