


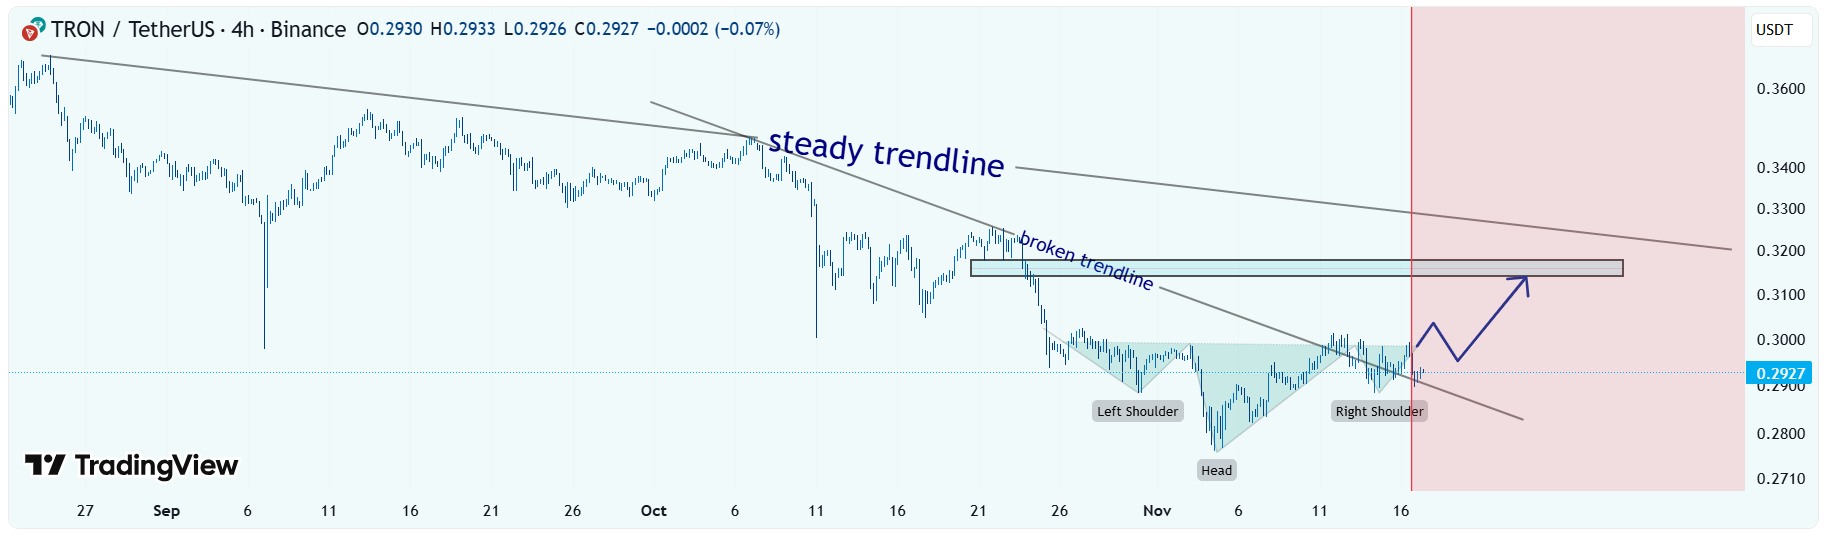
TRON: an inverse Head and Shoulders
-
 Hi!
Hi!Trend Overview:
The chart shows a prolonged downtrend, highlighted by the steady descending trendline. Price has been making lower highs and lower lows, consistent with a bearish market structure.Trendline Break:
Recently, a shorter-term descending trendline was broken to the upside, signaling potential bullish pressure and a shift in momentum.Pattern Formation:
A classic inverse head and shoulders pattern has formed:
Left Shoulder: 0.2900 level
Head: 0.2765 level
Right Shoulder: ~0.2920 levelThis pattern suggests a potential reversal from the prior downtrend to an upward move.
Target Zone:
The target of the head and shoulders pattern is marked around 0.3140–0.3180, representing the measured move from the head to the neckline. This is a key resistance zone where sellers might appear. -
Inverse H&S forming is one of the strongest reversal patterns.


-
Neckline breakout will decide if TRX can flip momentum bullish.

