


ETC(ethereum classic) chart analysis and bullish signal
-
Ethereum Classic is currently attempting to break above the 200-period moving average, a key resistance level, and a major supply zone on the 4-hour chart. Although it’s facing resistance at the moment, a decisive breakout through these overlapping resistance zones could provide an attractive long-entry opportunity with a favorable risk-to-reward ratio.
Given that this resistance area has rejected multiple breakout attempts in the past, the probability of a successful breakout this time appears relatively high.
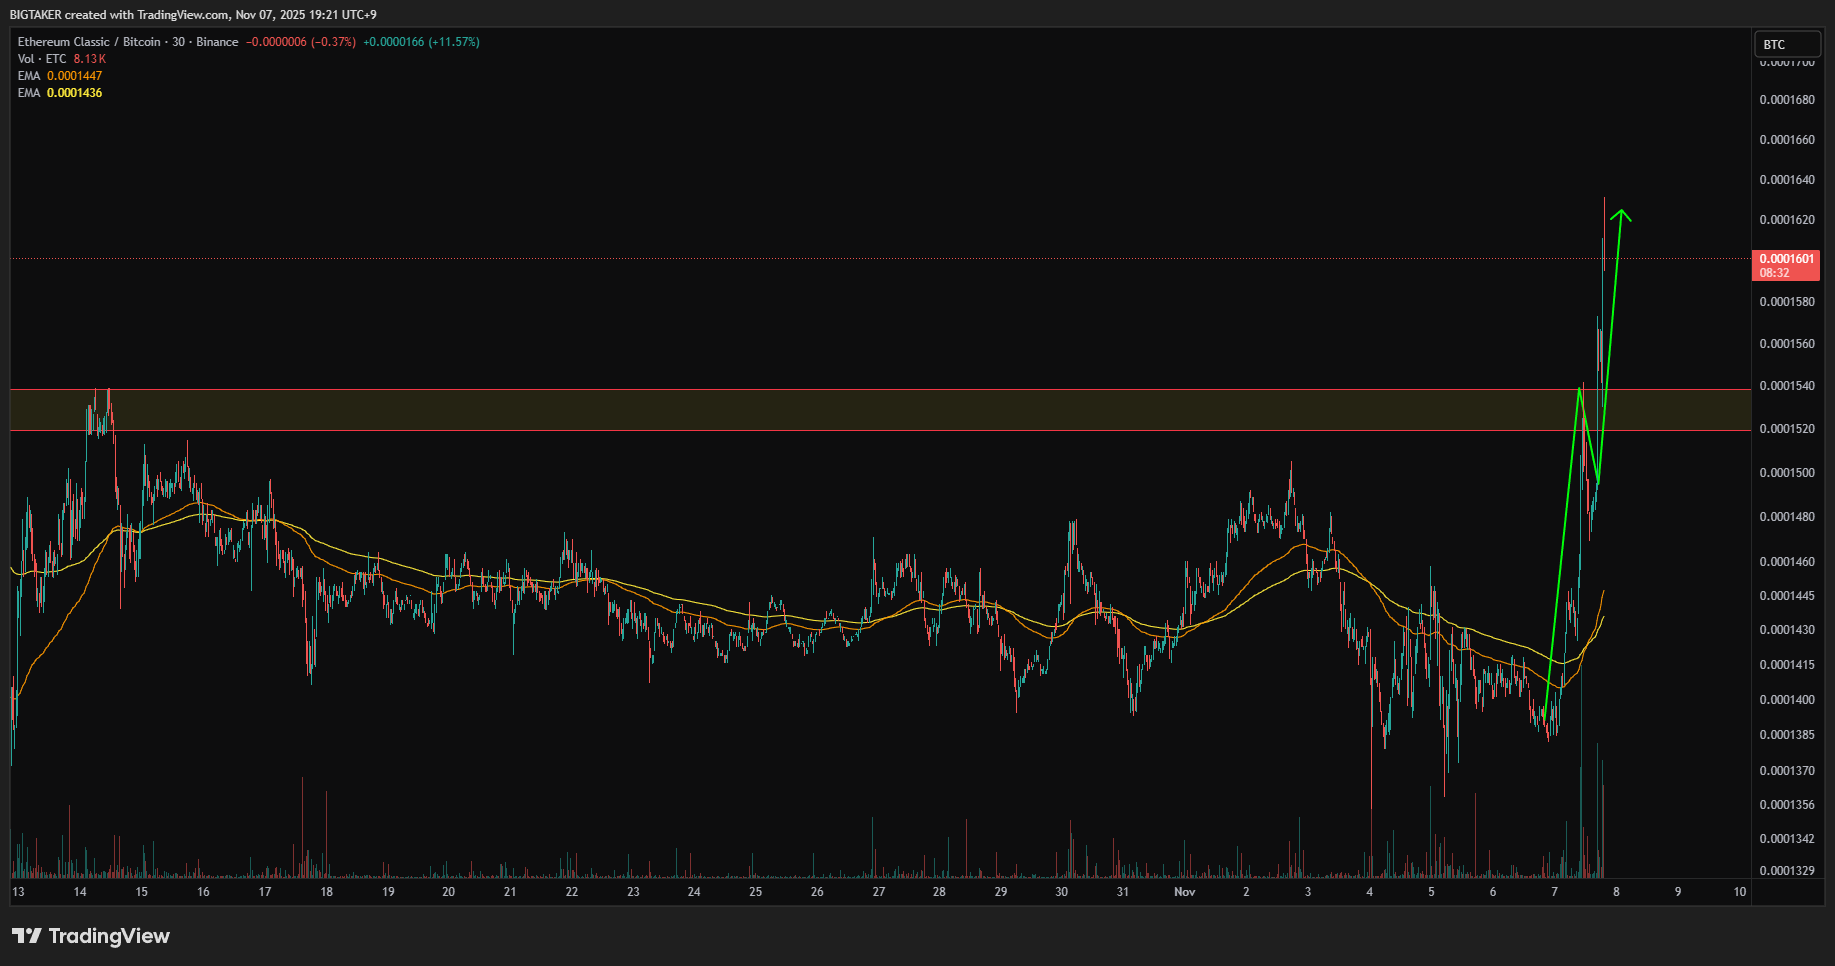
The ETC/BTC chart has also cleared several major resistance levels, suggesting that ETC could follow a similar pattern to recent strong performers such as ZEC, DASH, and 1INCH.
The bullish alignment on the ETC/BTC chart also indicates that Ethereum Classic is outperforming Bitcoin.
If Ethereum Classic confirms a breakout above the resistance zone, I will share an updated analysis on the subsequent price outlook.
-
ETC flashing early signs of reversal — MACD crossover confirms it.

-
Not much hype yet, which makes this setup even stronger.
