


ETH/USD (Ethereum vs U.S. Dollar) on 2-hour timeframe...
-
 ETH/USD (Ethereum vs U.S. Dollar) on what seems to be the 2-hour timeframe.
Here’s what’s visible:
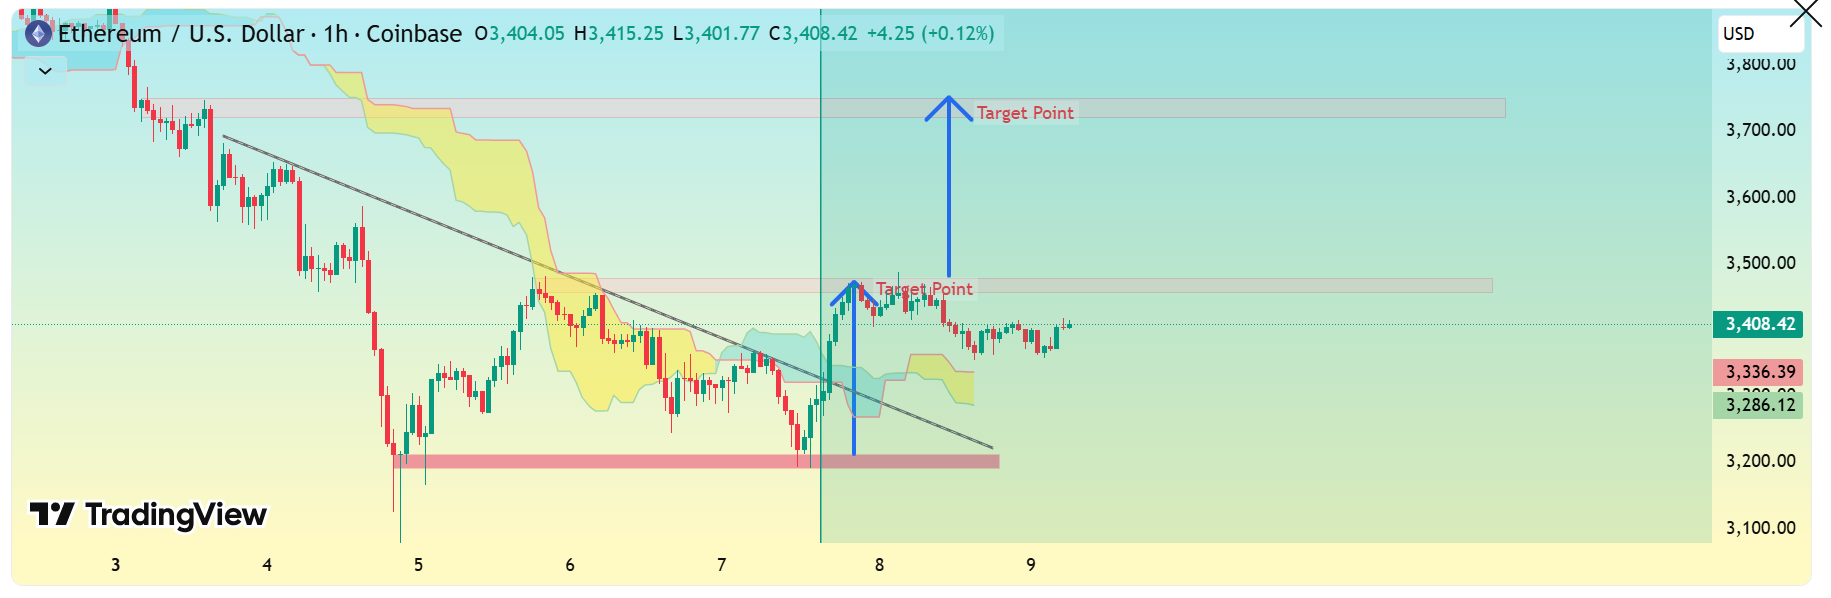
The chart shows a descending trendline (downtrend) and a horizontal support zone around the $3,200 area.
My marked two “Target Points” above, suggesting a bullish reversal setup from that support.
 Target Levels (approximate based on chart scale)
-
First Target Point: around $3,450 – $3,480
→ This aligns with the first resistance zone and the projected move from the descending breakout. -
Second Target Point: around $3,720 – $3,750
→ This represents the measured move from the pattern height projected upward — the next major resistance.
-
-
ETH’s short-term range tightening — breakout above $3.1K could trigger momentum.

-
RSI recovery on lower timeframes hints at buyer strength returning.
