


USDT Dominance at Key Resistance – Crypto Reversal Ahead?
-
 One of the key indices we can use to gauge the direction of the cryptocurrency market is USDT Dominance (USDT.D) .
In this analysis, let's look at USDT.D% on the weekly timeframe.
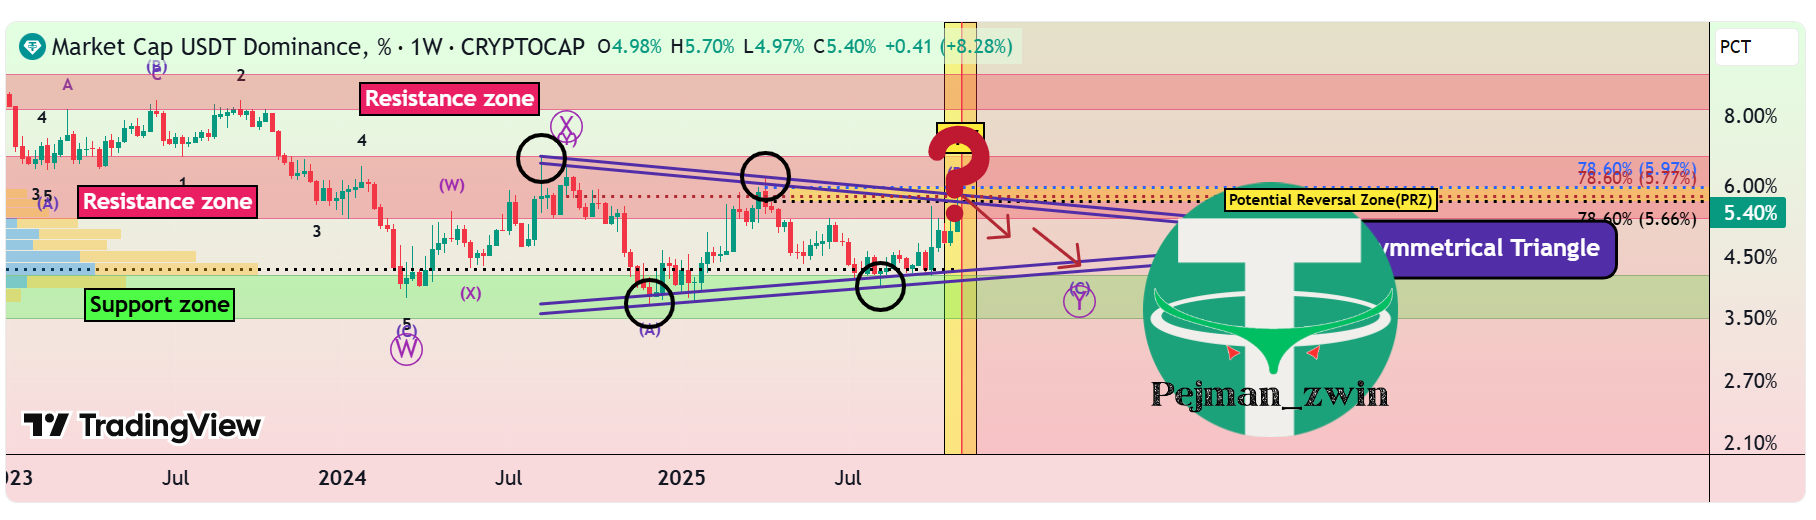
Currently, USDT.D% is moving in a Resistance zone(6.77%-5.25%), Time Reversal Zone(TRZ), and is near a Potential Reversal Zone (PRZ)[5.98%-5.66%].
From a classic technical analysis perspective, it seems that USDT.D% is inside a Symmetrical Triangle and is currently near the upper lines of this triangle.
In terms of Elliott Wave theory, USDT.D% looks like the corrective wave B of the main wave Y is completing.
So we might expect USDT.D% to move downwards again, at least towards the lower lines of the symmetrical triangle.
Note: This is purely a technical analysis. USDT.D% is at a sensitive area, and if it breaks above the upper lines of the triangle, we should anticipate a decline in Bitcoin and other tokens.
What do you think? Can USDT.D% break the upper lines of the symmetrical triangle and push the crypto market down again, or will the market bounce back? Let me know your thoughts!
Please respect each other's ideas and express them politely if you agree or disagree.
Market Cap USDT Dominance% Analyze (USDT.D%), Weekly frame.
Be sure to follow the updated ideas.
Do not forget to put a Stop loss for your positions (For every position you want to open).
Please follow your strategy and updates; this is just my Idea, and I will gladly see your ideas in this post.
Please do not forget the
 ' like' button
 & Share it with your friends; thanks, and Trade safe.
 -
Reversal depends on BTC’s next move — liquidity still concentrated in stables.

