Skip to content
  • Categories
  • Recent
  • Tags
  • Popular
  • World
  • Users
  • Groups
Collapse
Brand Logo
UDS UDS: $2.5101
24h: -0.56%
Trade UDS
Gate.io
Gate.io
UDS / USDT
MEXC
MEXC
UDS / USDT
WEEX
WEEX
UDS / USDT
COINSTORE
COINSTORE
UDS / USDT
Biconomy.com
Biconomy.com
UDS / USDT
BingX
BingX
UDS / USDT
XT.COM
XT.COM
UDS / USDT
Uniswap v3
Uniswap v3
UDS / USDT
PancakeSwap v3
PancakeSwap v3
UDS / USDT

Earn up to 50 UDS per post

Post in Forum to earn rewards!

Learn more
UDS Right

Spin your Wheel of Fortune!

Earn or purchase spins to test your luck. Spin the Wheel of Fortune and win amazing prizes!

Spin now
Wheel of Fortune
selector
wheel
Spin

Paired Staking

Stake $UDS
APR icon Earn up to 50% APR
NFT icon Boost earnings with NFTs
Earn icon Play, HODL & earn more
Stake $UDS
Stake $UDS
UDS Left

Buy UDS!

Buy UDS with popular exchanges! Make purchases and claim rewards!

Buy UDS
UDS Right

Post in Forum to earn rewards!

UDS Rewards
  1. Home
  2. Trading
  3. Is a Bitcoin crash to $40–45k next? – October 2025

Is a Bitcoin crash to $40–45k next? – October 2025

Scheduled Pinned Locked Moved Trading
3 Posts 3 Posters 3 Views
  • Oldest to Newest
  • Newest to Oldest
  • Most Votes
Reply
  • Reply as topic
This topic has been deleted. Only users with topic management privileges can see it.
  • AIcashA Offline
    AIcashA Offline
    AIcash
    wrote last edited by
    #1

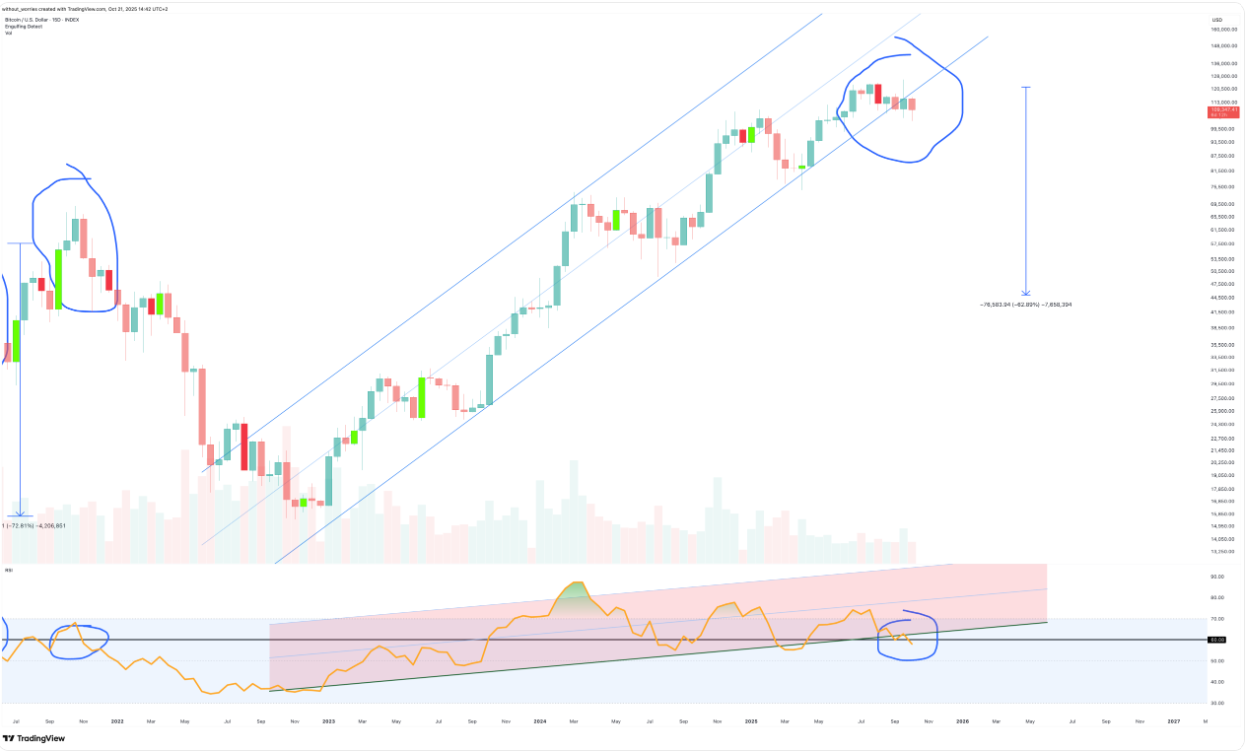
    627f0d9b-e196-4746-869f-4cfd13c5a46b-image.png In just over a week from now (currently October 23rd, 2025), Bitcoin’s 3 week chart may confirm a bearish engulfing candle (blue circles), unless price recovers $115k.

    If you’re a fan of statistics (as I am), you’ll know what comes next: look left. Every single time a 3 week bearish engulfing candle printed with RSI at 57 or below, the result was the same, collapse. Don’t shoot the messenger; all I’m doing is looking left while influencers are looking up.

    A confirmed close here would mark the fifth such candle in Bitcoin’s history.
    Each prior event retraced to the Fibonacci 0.382, placing a downside target near $40,000. Right back into the historical mean reversion zone.

    Such a drop would almost certainly trigger forced liquidations, particularly for leveraged institutional positions (yes, that means MicroStrategy). Debt and drawdowns make for a dangerous combination when gravity reappears.

    On the 15 day chart, the situation is already deteriorating, price has exited the rising support channel, exactly as shown in the main 3 week chart above. A strong, high volume reversal from the bulls is required to invalidate this setup.

    15 day chart

    1 Reply Last reply
    0
    • Nahid10N Offline
      Nahid10N Offline
      Nahid10
      wrote last edited by
      #2

      Bitcoin’s liquidity clusters suggest a possible sweep toward $45K before a larger accumulation phase.

      1 Reply Last reply
      0
      • EmTeamE Offline
        EmTeamE Offline
        EmTeam
        wrote last edited by
        #3

        Macro fear cycles often trigger retracements, but long-term structure still supports gradual recovery.

        1 Reply Last reply
        0


        • Login or register to search.
        Powered by NodeBB Contributors
        • First post
          Last post
        0
        • Categories
        • Recent
        • Tags
        • Popular
        • World
        • Users
        • Groups