


Is a Bitcoin crash to $40–45k next? – October 2025
-
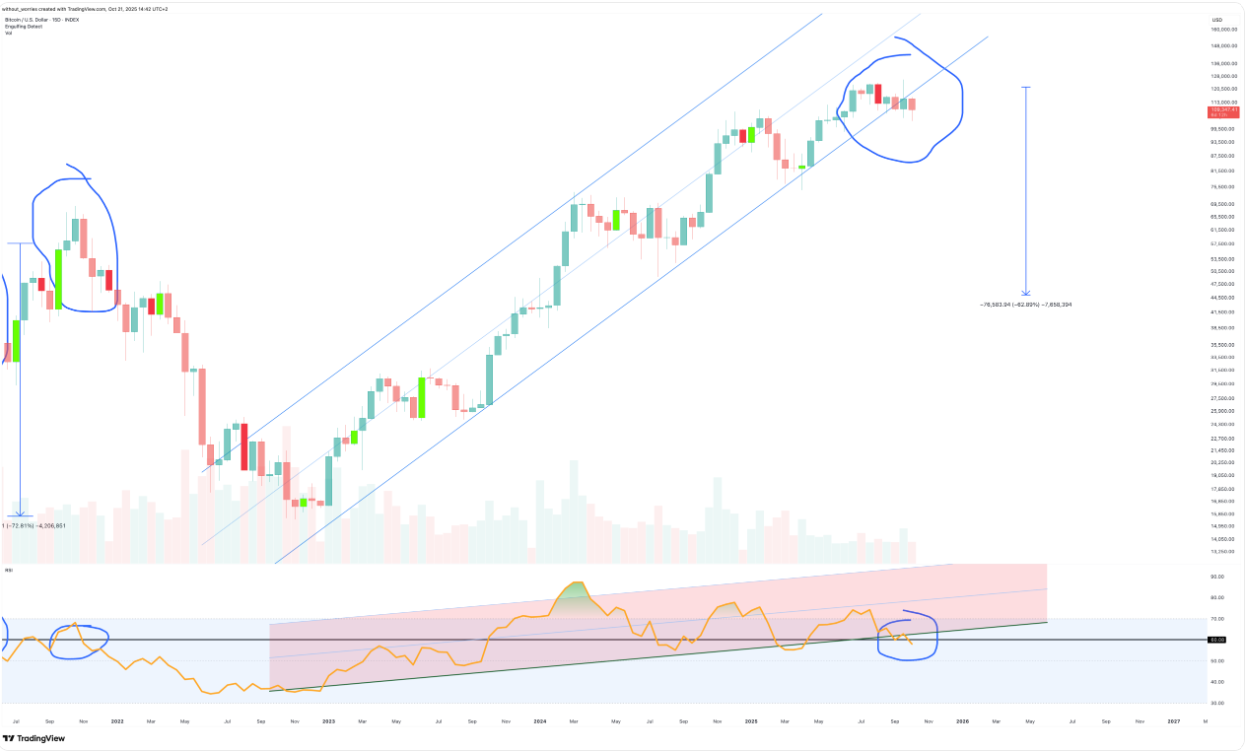 In just over a week from now (currently October 23rd, 2025), Bitcoin’s 3 week chart may confirm a bearish engulfing candle (blue circles), unless price recovers $115k.
If you’re a fan of statistics (as I am), you’ll know what comes next: look left. Every single time a 3 week bearish engulfing candle printed with RSI at 57 or below, the result was the same, collapse. Don’t shoot the messenger; all I’m doing is looking left while influencers are looking up.
A confirmed close here would mark the fifth such candle in Bitcoin’s history.
Each prior event retraced to the Fibonacci 0.382, placing a downside target near $40,000. Right back into the historical mean reversion zone.Such a drop would almost certainly trigger forced liquidations, particularly for leveraged institutional positions (yes, that means MicroStrategy). Debt and drawdowns make for a dangerous combination when gravity reappears.
On the 15 day chart, the situation is already deteriorating, price has exited the rising support channel, exactly as shown in the main 3 week chart above. A strong, high volume reversal from the bulls is required to invalidate this setup.
15 day chart
-
Bitcoin’s liquidity clusters suggest a possible sweep toward $45K before a larger accumulation phase.