


Bitcoin - Relief rally is imminent!

-
 Introduction
Bitcoin (BTC) has shown strong downward pressure over the past several days, yet it is beginning to display early signs of stabilization within key higher-timeframe fair value gap zones. Even though the current market structure remains bearish, several technical elements are aligning that suggest the potential for a relief rally. With multiple patterns and liquidity levels converging, the market may be preparing for a temporary upside correction before determining its next major direction.Weekly FVG
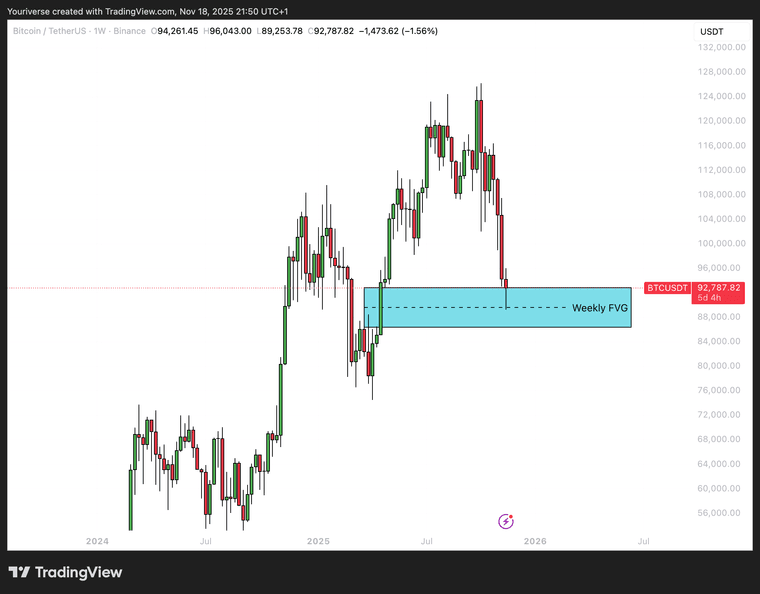
On the weekly timeframe, BTC recently tapped into the weekly fair value gap and filled roughly fifty percent of this imbalance. This partial fill often indicates that the market is collecting liquidity before initiating a larger move. As a result, this weekly FVG acts as a strong demand zone where buyers tend to become active again, offering an area where price often stabilizes, even if only temporarily. The reaction here suggests that BTC may be forming a short-term base.Daily FVG
On the daily timeframe, another fair value gap is present, and it aligns almost perfectly with the weekly zone. Above current price action lies a clear descending trendline, which is likely to act as resistance on any upward push. The combination of the daily FVG and the downward trendline creates a technically significant decision point. If BTC reaches this area, it may face renewed selling pressure, making this zone crucial for determining whether the market can extend higher or whether the downtrend will reassert itself. Relief Rally
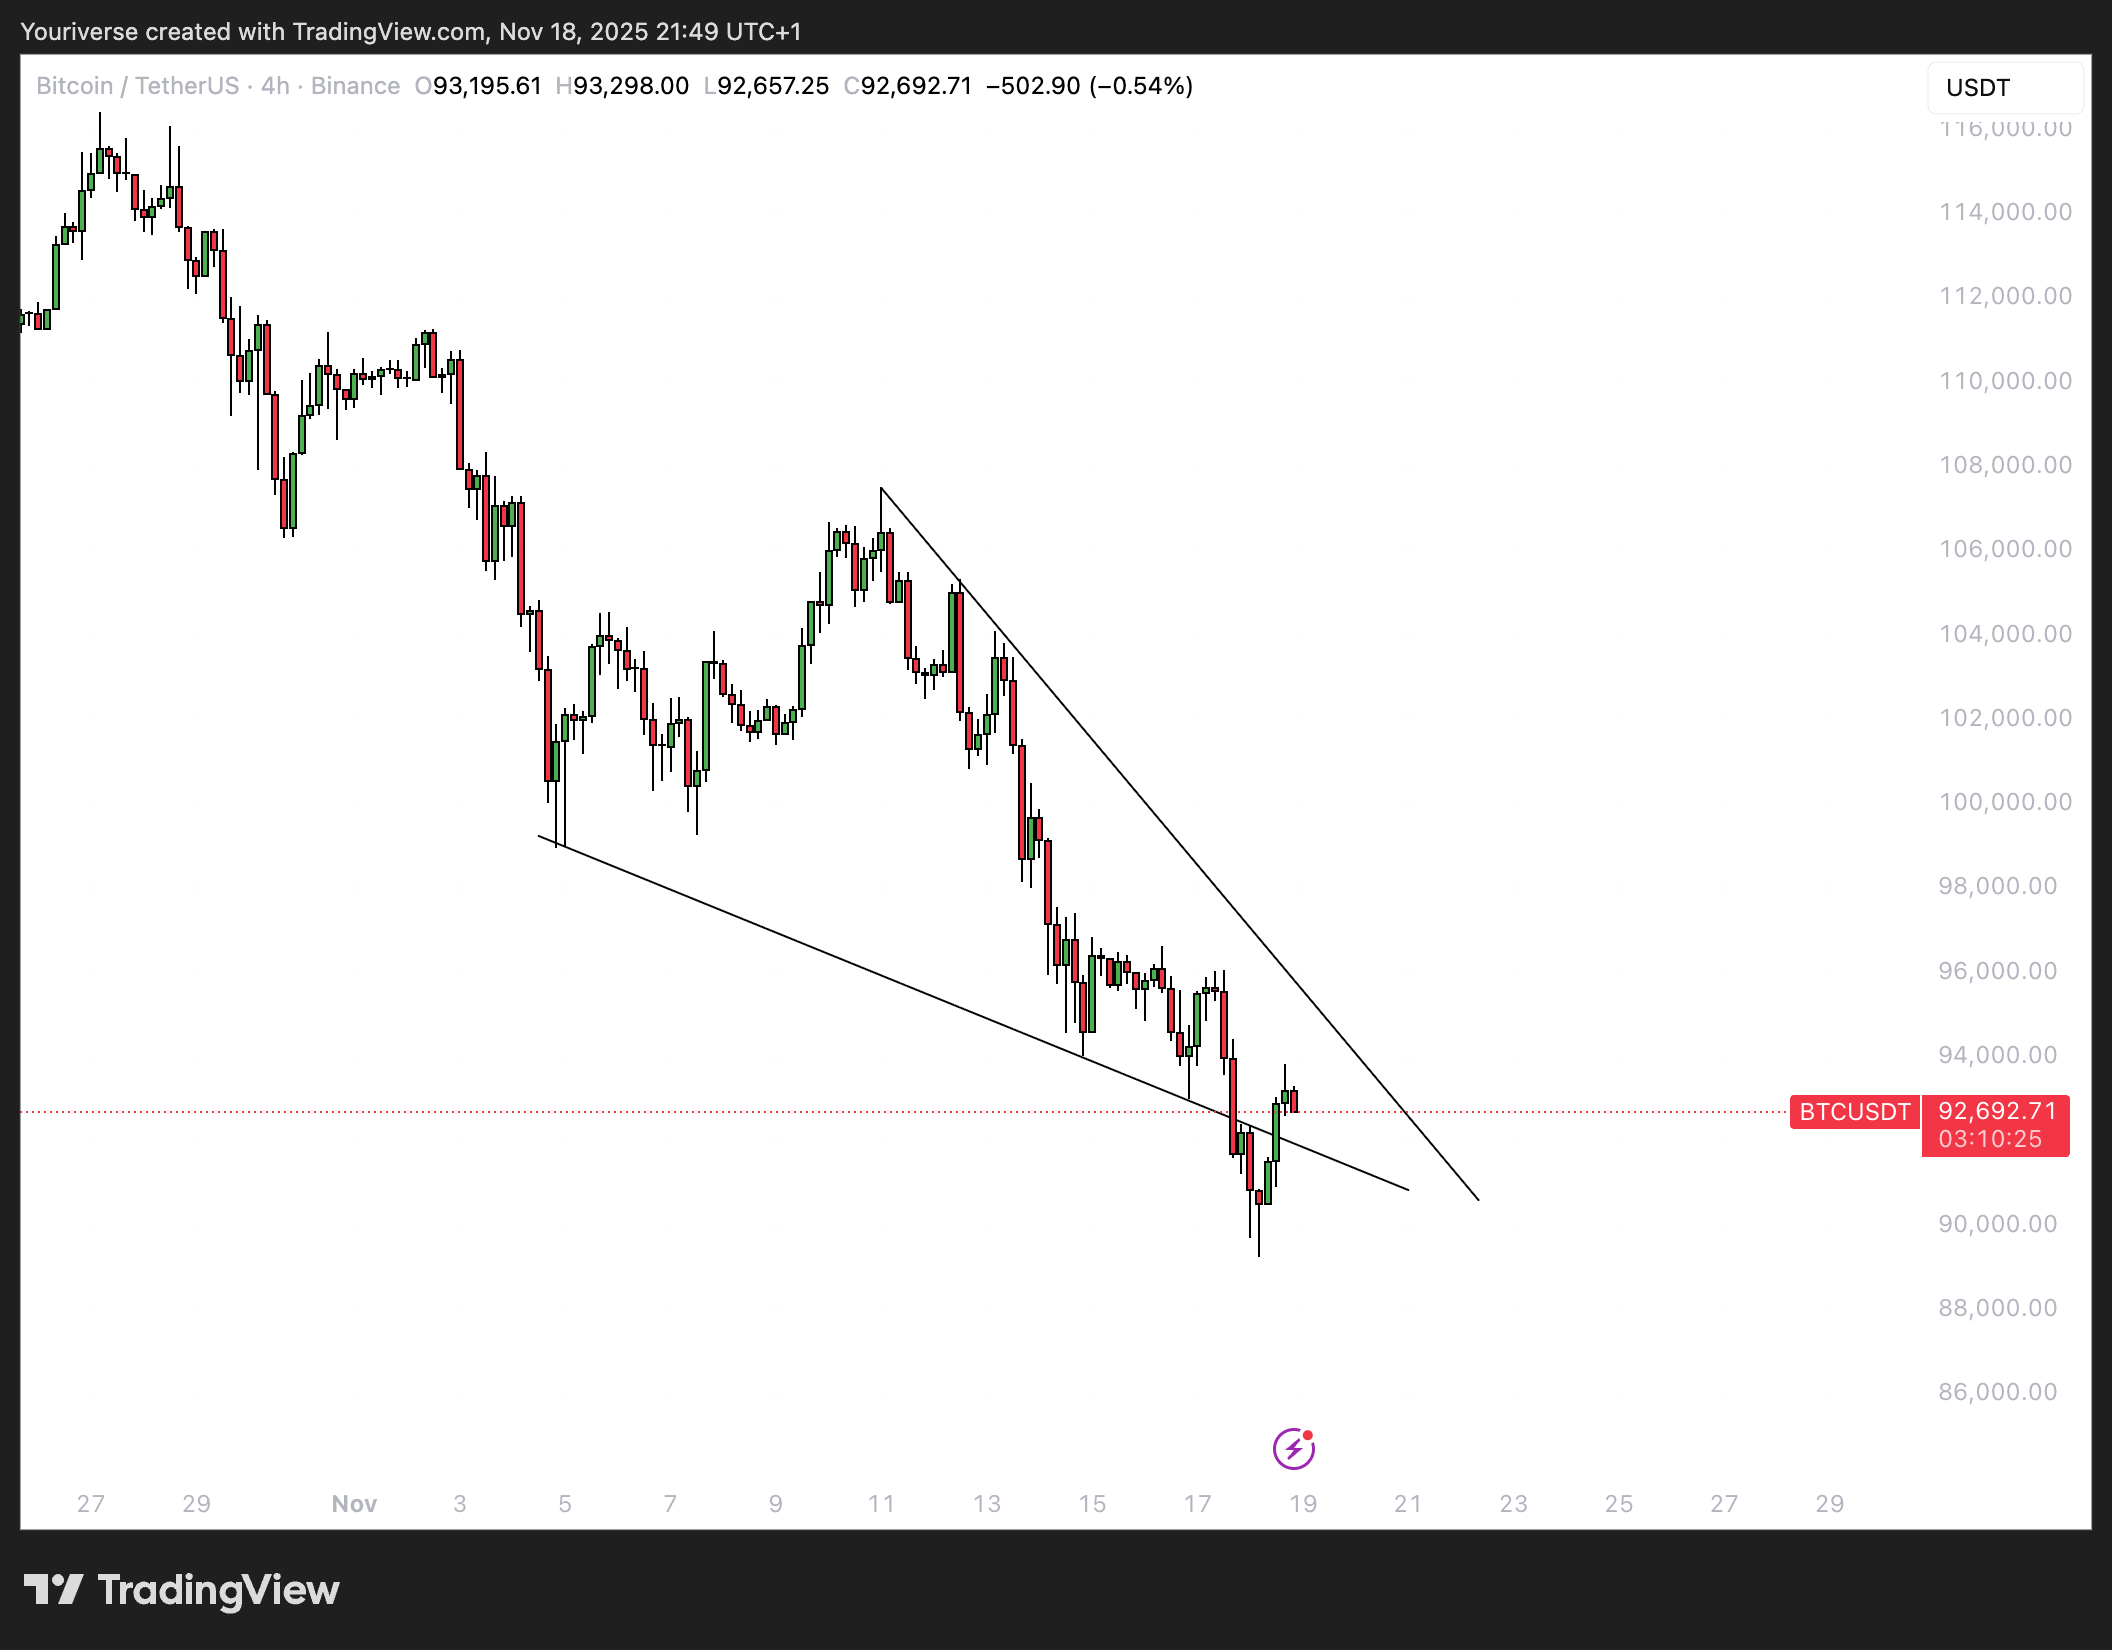
The first zone to watch lies just above the current price level, where a 4-hour bearish FVG overlaps with the descending trendline. This confluence is likely to act as immediate resistance, making an initial rejection from this level highly plausible. After a potential rejection, price may revisit the bullish 4-hour FVG below, where buyers are expected to step in again. From this supportive zone, BTC could attempt to break through the descending trendline and continue higher toward the upper 4-hour bearish FVG around the 98,000-dollar region. This serves as a logical target for a relief rally, should momentum continue to build.

Conclusion
BTC is currently positioned within an important higher-timeframe demand zone, strengthened by the overlap of both the weekly and daily FVGs. Although the broader market structure remains bearish, the fake-out within the falling wedge on the 4-hour chart signals that a relief rally may be developing. The immediate resistance above price will provide the first major test. If Bitcoin finds renewed momentum from the bullish 4-hour FVG and successfully breaks the descending trendline, an upward move toward 98,000 dollars becomes increasingly realistic. For now, BTC appears to be setting the stage for a corrective bounce, with key levels offering clear guidance on how this scenario could unfold.