


Bitcoin - Power of 3 in play!
-
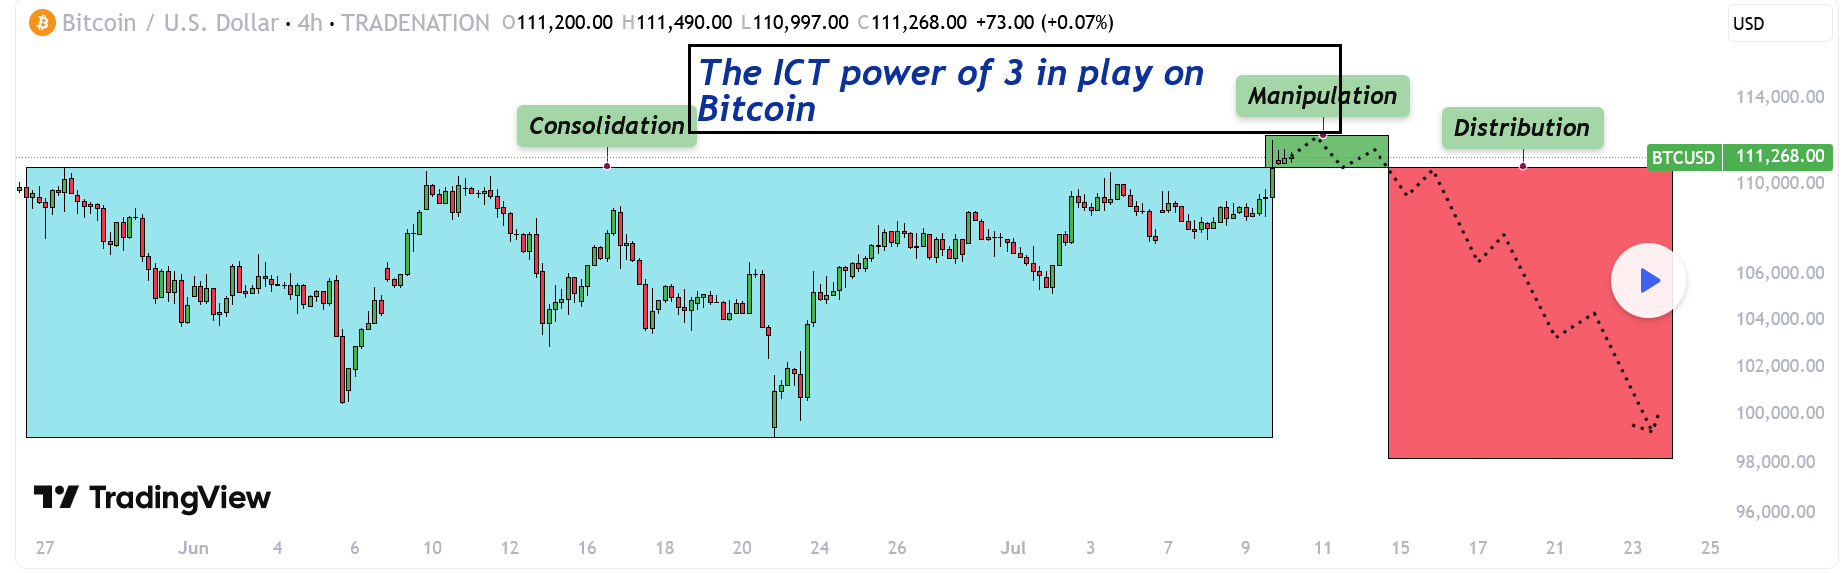
The chart illustrates a classic application of the ICT concept known as the "Power of 3," a theory that outlines a common market behavior pattern consisting of three phases: consolidation, manipulation, and distribution. This model is often used by smart money traders to identify points where institutional players may be accumulating or offloading positions, typically by targeting retail liquidity.Consolidation
In this scenario, Bitcoin has exhibited a prolonged period of consolidation, where price fluctuated within a defined range throughout most of June and into early July. This range-bound movement, highlighted in blue, represents the market gathering orders from both buyers and sellers, creating a liquidity pool on either side of the range. During this phase, market participants become uncertain about the next direction, while smart money positions itself for the next move.Manipulation/sweeping liquidity
Recently, Bitcoin has broken out of this consolidation range in an upward move, which is now being interpreted as the manipulation phase. This move served to sweep the liquidity resting just above the established highs of the range. These highs were prime areas for stop-losses of short sellers and breakout entries of longs, making them attractive targets for institutional manipulation. The price push above this level, marked in green, appears to be a false breakout designed to trap breakout traders and trigger stops before a likely reversal.Possible distribution phase
Following this manipulation phase, the chart suggests we are entering or have just begun the distribution phase, marked in red. Distribution in the context of the Power of 3 refers to the process where smart money offloads their positions onto unsuspecting buyers who entered during the manipulation. The anticipated outcome is a sustained move to the downside, aligning with the forecasted bearish structure shown on the right side of the chart.Conclusion
In conclusion, the chart reflects a textbook ICT Power of 3 pattern in play on Bitcoin. After a lengthy period of sideways consolidation that built liquidity on both sides, Bitcoin executed an upward manipulation to capture liquidity above the range. Now, with the highs swept and buy-side liquidity taken, the market looks poised for distribution, signaling a probable downward move in the near term. Traders familiar with smart money concepts would view this as a high-probability reversal zone.Disclosure: I am part of Trade Nation's Influencer program and receive a monthly fee for using their TradingView charts in my analysis.
Thanks for your support.
- Make sure to follow me so you don't miss out on the next analysis!
- Drop a like and leave a comment!